Stocks continue to hover near multi-week highs but near-term concerns are mounting. In this weekly update, we’ll take a closer look at the S&P 500 (INDEXCBOE:.INX) and Nasdaq (INDEXNASDAQ:.IXIC) and more.
Equity outflows are fueling stock gains despite market breadth concerns.
Key Takeaways: The major stock market indexes have rallied but momentum and breadth have been less than convincing. Sentiment surveys show optimism, yet equity funds have seen a surge in outflows (which is bullish for stocks). Commodities (especially Copper) and bonds are not confirming equity market strength.
The S&P 500 found support near 2700, which coincided with 50-day average and the rising trend line off of the April and May lows. The ensuing rally carried the S&P 500 above resistance near 2800 (which is where the index peaked in March and June).
S&P 500 Chart
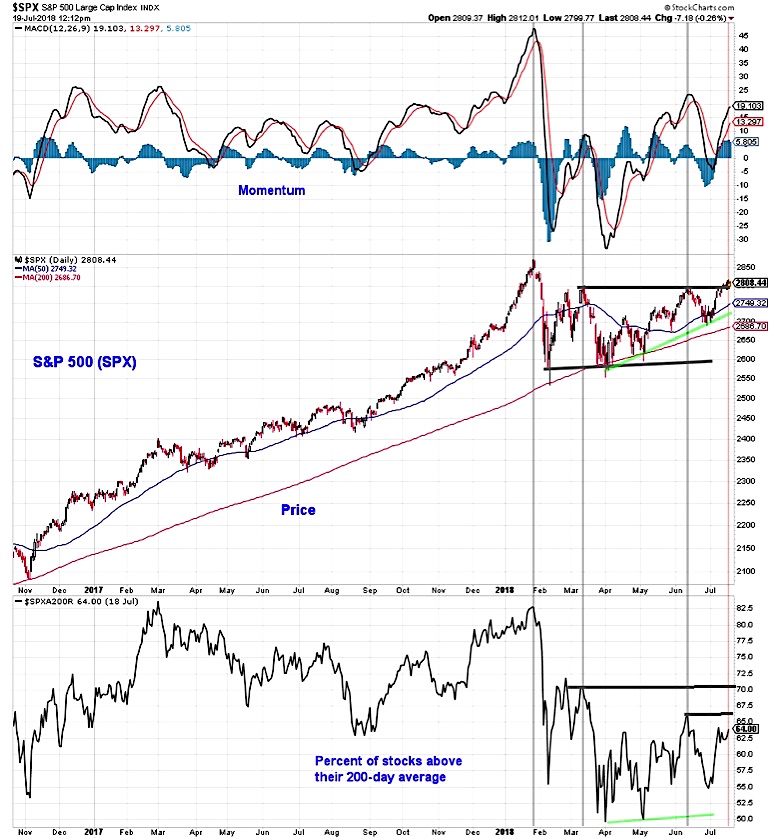
The series of higher lows on the chart is encouraging. Daily momentum, however, remains below its June high (despite new price highs) and the weekly momentum has struggled to establish a positive trend. Breadth remains lackluster. The S&P 500 rallied 1.5% last week, yet both the NYSE and NASDAQ had more stocks down than up. Within the S&P 500, the percentage of stocks trading above their 200-day averages remains shy of the June and March peaks. While the S&P 500 has closed to within nearly 2% of its January high, half of the stocks in the index are still 10% or more below their 52-week highs peaks.
The momentum and breadth divergences that have appeared for the S&P 500 are even more pronounced on the NASDAQ (perhaps not surprising given more significant price gain for that index).
NASDAQ Chart
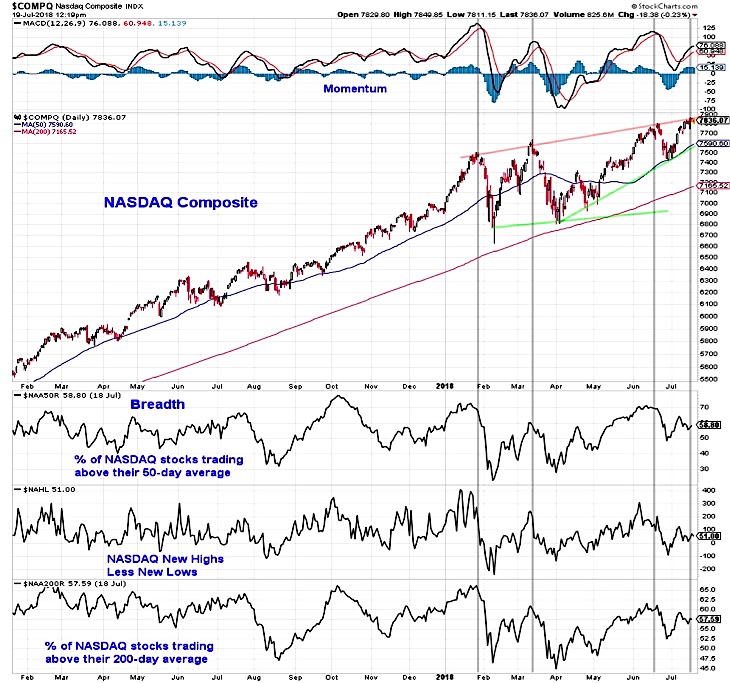
Momentum which was improving into the June peak has failed to confirm the July strength. Breadth divergences show up in terms of weekly advance/decline data but also in the daily net new highs and percentage of stocks above their 50-day or 200-day averages. These divergences can persist for some time (the NASDAQ is up 13% for 2018, and these divergences have been present since the index made new highs in March). At this point, these breadth indicators are failing to confirm index level strength, not necessarily flagging the risk imminent weakness (that would take a move below their June lows).
Much of the sentiment work we look at has shown an uptick in optimism since the second quarter. The Investors Intelligence data shows bulls (at 55%) are nearing their March and June peaks and the NAAIM exposure index is in the 80’s (shy of its June high, but well above the May low in the 50’s). One showing a pronounced level of investor skepticism is fund flows. In recent years, stocks have struggled when funds have attracted inflows and have rallied when investors fear has led to outflows. Over the past four weeks, investors have withdrawn more than $30 billion from equity funds. Even so investors are claiming some degree of optimism, their actions suggest more skepticism and this has helped buoy stocks.
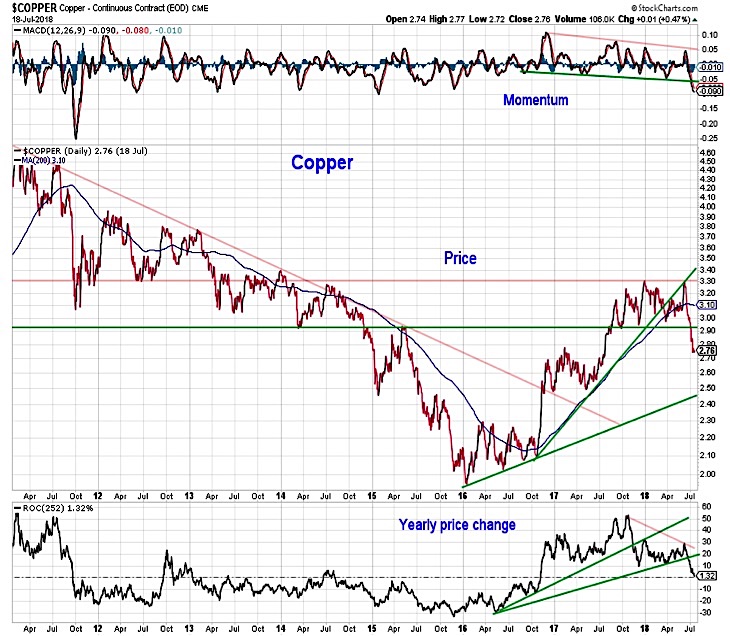
The macro environment has also posed a challenge for equities. In this week’s Macro Update we discussed the upcoming earnings season. We should also consider recent developments in the commodity and fixed income markets. Copper rallied to the top of its recent trading range on news of a Chilean mine closure in June. The failure to breakout from either a price or momentum perspective has been followed by a nearly 20% decline, in the process breaking below support near 2.90. With momentum accelerating to the downside, copper could be poised to test support near 2.50. Commodity market weakness is not limited to copper. The CRB index, which made a new high in May, has also broken down from a trend perspective.
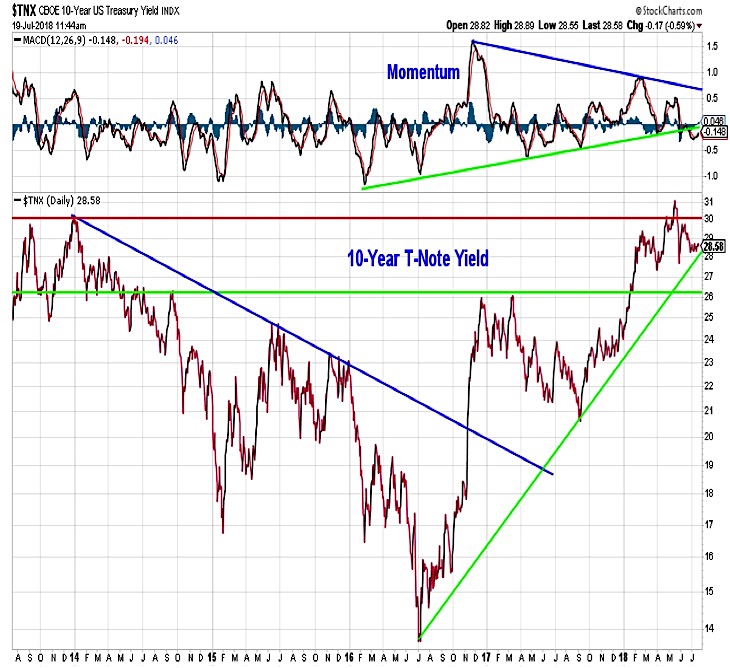
Perhaps even more important for stocks is the next move in bond yields. Stable yields (in the vicinity of 2.8% to 2.9% for the 10-year T-Note) could be a boon for the economy and help fuel stock price gains. A further pullback in yields would suggest that the bond market is offering an opinion that differs from the stock market consensus (as well as Fed Chairman Powell). The momentum uptrend that has supported the rise in yields since 2016 has been broken. Excessive pessimism in bonds has been relieved but sentiment is still far from optimism. Combined with the momentum backdrop, this could help keep downward pressure on yields. Minor trendline support is near 2.8% from a yield perspective, but more significant support is near 2.6%.
Twitter: @WillieDelwiche
Any opinions expressed herein are solely those of the author, and do not in any way represent the views or opinions of any other person or entity.


