Key Stock Market Takeaways:
The rally off the October lows has faded at resistance and the broader market continues to be a source of weakness and evidence of capitulation is lacking.
Patience may be required as equities need time to establish a base and allow investor sentiment to be washed out.
S&P 500 Index – Price Analysis & Market Breadth
Stocks surged higher in the immediate wake of last week’s elections as investors expressed collective relief that the mid-term campaign was over and perhaps in the hope that historically favorable seasonal patterns would emerge to carry stocks higher into year-end. That celebration, however, was short-lived and the S&P 500 proceeded to post losses in each of the next five trading sessions. The lack of follow through on rallies and still lackluster broad market participation (both domestically and internationally) is becoming more consistent with market behavior typically seen during cyclical bear markets (e.g., 2011, 2015-16).
While bull markets can be characterized by repeatedly getting up to and through levels you didn’t think were possible, bear markets can be characterized by repeatedly getting down to and through levels you never thought the market would re-visit. For now, a cautious approach remains warranted as the S&P 500 moves between support near 2700 and well-tested resistance near 2800.
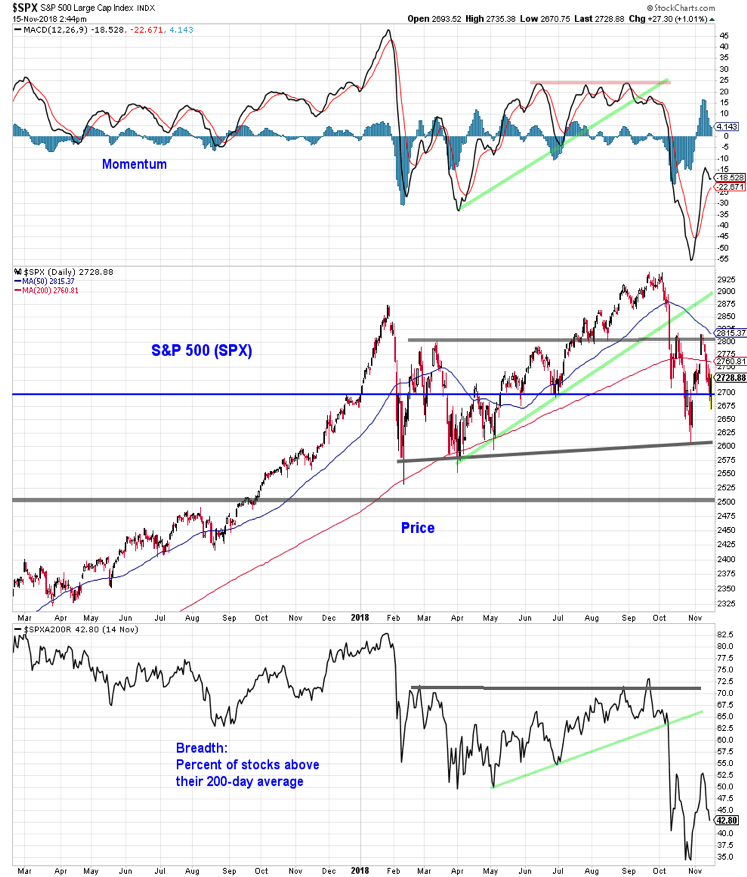
The chart above shows that 43% of S&P 500 stocks are trading above their 200-day averages (recently it got as high as 52%). This may overstate the health of the broad market. Less than 30% of stocks on the NYSE and NASDAQ are currently above their 200-day averages.
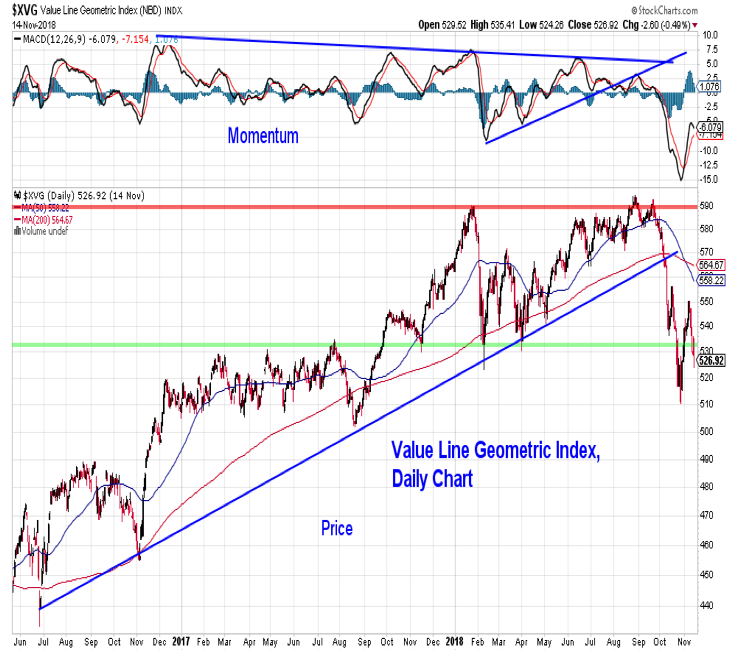
Looked at another way, while the S&P 500 index remains in positive territory for 2018, the Value Geometric Average (which is a proxy for performance of the median stock) is down over 6% on a year-to-date basis and has already seen its 50-day average cross below its 200-day average. The degree to which breadth indicators have deteriorated suggests an immediate return to strength is not likely. In addition to near-term caution, investors may need to exercise patience as stocks establish and test lows.
While there may be a desire to look for prospective bottoming patterns and hope for quick reversals, that appears to be premature. As will be shown on the next page, longer-term measures of investor sentiment have not been washed out. In addition, we have yet to witness the type of panic selling that has often been associated with sustainable market lows.
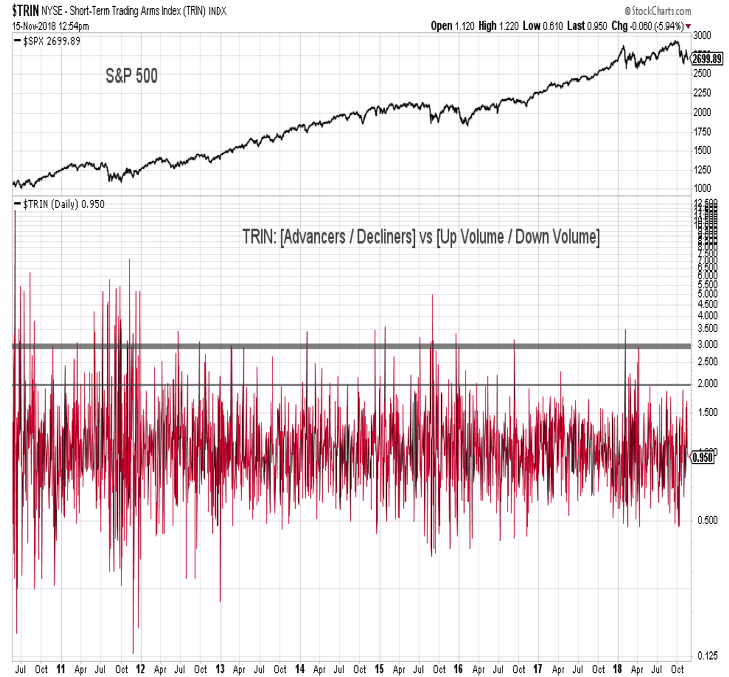
At a minimum, we would expect to see the TRIN (which measures the relationship between the advance/decline ratio and the up volume/down volume ratio) move above 2 and likely would like to see it surge above 3 as evidence that near-term selling has moved from being methodical to indiscriminate. In the wake of panic selling, we would expect to see daily breadth thrusts where upside volume overwhelms downside volume by better than 10-to-1.
It may be too early to look for panic selling given the still entrenched optimism that is apparent in the weekly sentiment surveys and anecdotally present in the expectations of a strong year-end rally. Short-term sentiment measures, especially the put/call ratios do point to excessive fear and that may be enough to provide some near-term support for stocks, especially in the face of near-term oversold conditions.
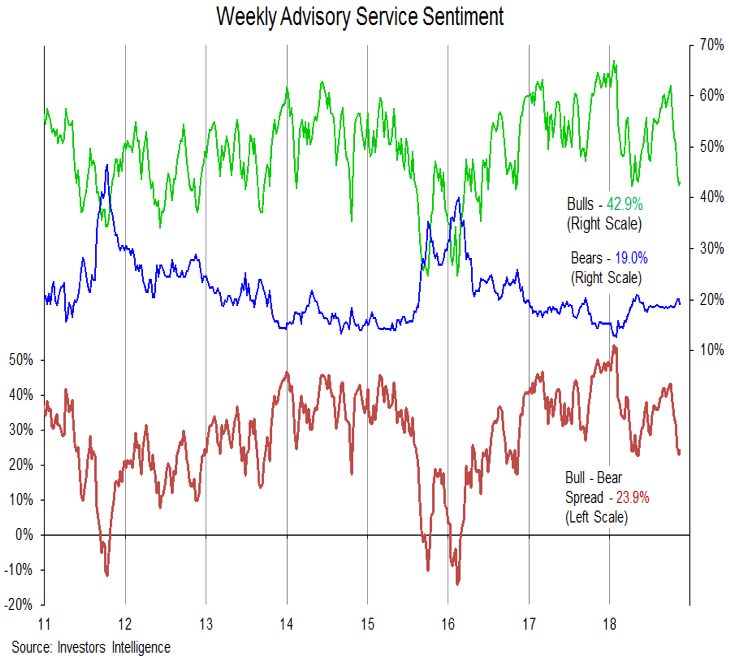
The weekly sentiment surveys show that excessive optimism (which was present earlier this year and was re-emerging this summer) has been relieved. However, bulls among advisory services remain above their early year lows, and bears remain shy of their early year highs. Bulls continue to outnumber bears by better than 2-to-1, and at recent cyclical lows (2011 and 2016), there were more bears than there were bulls. The weekly survey of individual investors from the AAII show a similar pattern.
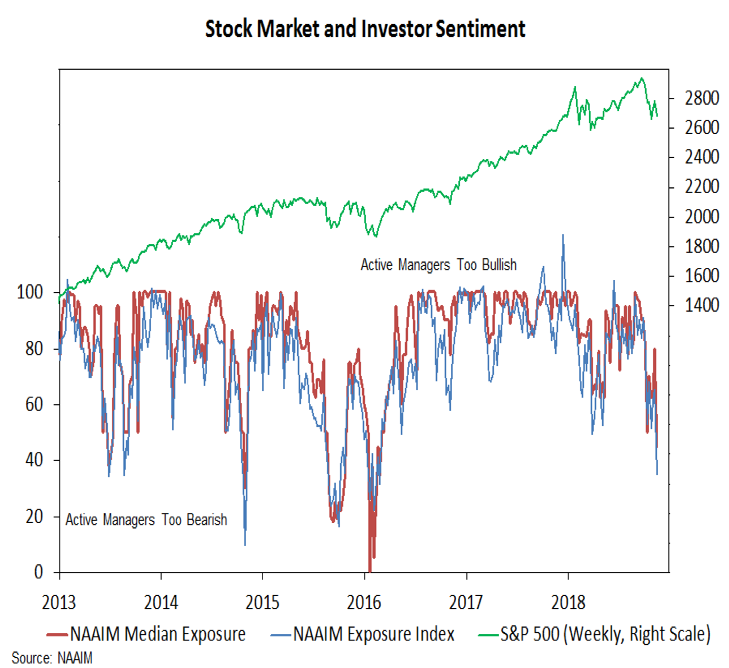
Data from the NAAIM, however, shows a shift toward a more cautious view. The NAAIM Exposure index fell to 35% this week, with median exposure dropping to 45%. This undercuts the recent lows and is a step in the right direction in terms of a meaningful re-set in investor sentiment. A continued shift toward the 2016 lows (near 20% in terms of the Exposure Index) may be needed to suggest that sentiment is indeed washed out.
Twitter: @WillieDelwiche
Any opinions expressed herein are solely those of the author, and do not in any way represent the views or opinions of any other person or entity.


