The latest rally attempt has seen indexes breakout above downtrends. But market internals could be/should be better.
Here’s our latest look at key technical and fundamental indicators and market trends for the trading week ending May 11, 2018.
Key Takeaways: The S&P 500 has bounced off its early May low and the Russell 2000 is approaching an all-time high. The market breadth backdrop is little changed and the absence of a breadth thrust has been notable even as indexes have rallied. Investor sentiment indicators show rallies continue to be loved and sell-offs produce fear. A longer-term look at sentiment suggests optimism may not yet be relieved.
Stocks Rallying But Back Drop Is Little Changed
The S&P 500 has reversed course over the past week after testing its 200-day average and seeing the percentage of stocks within the index drop to 50% (matching the cycle low). Now the index has broken through the pattern of lower highs that had emerged off of the January peak, with momentum leading the way. Still lacking has been a notable improvement in the breadth back drop. While breadth has not deteriorated further, it has also not signaled broad rally participation.
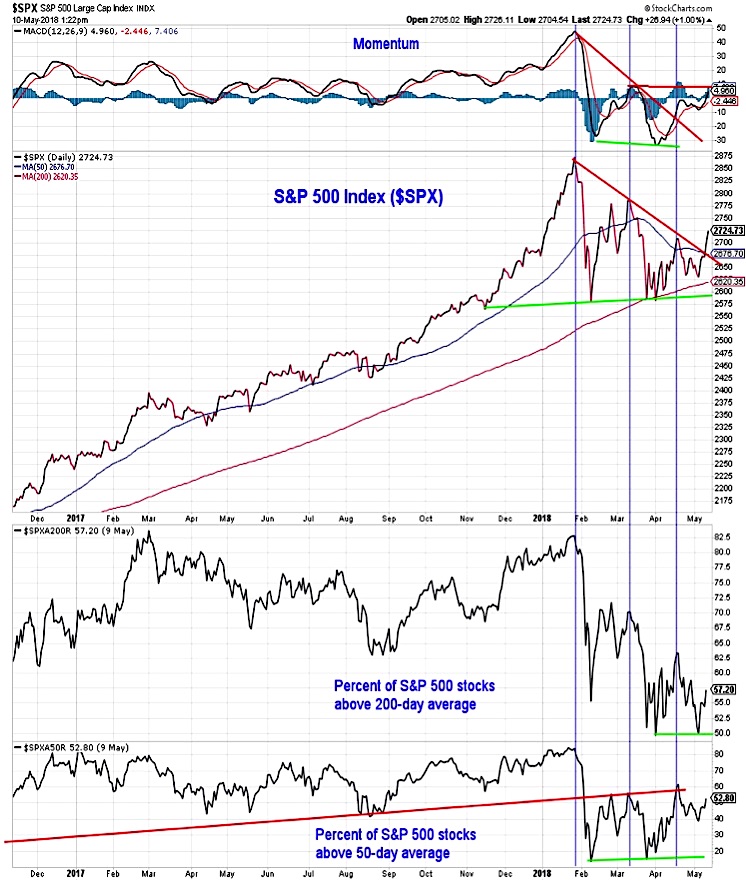
The S&P 500 has eclipsed its April high, but the percentage of stocks within the index above their 200-day averages has lagged and nearly a quarter of the stocks in the index remain 20% or more below their respective 52-week highs. So while the index-level gains over the past week have been impressive, the broad market is not yet signaling that the consolidation phase has concluded.
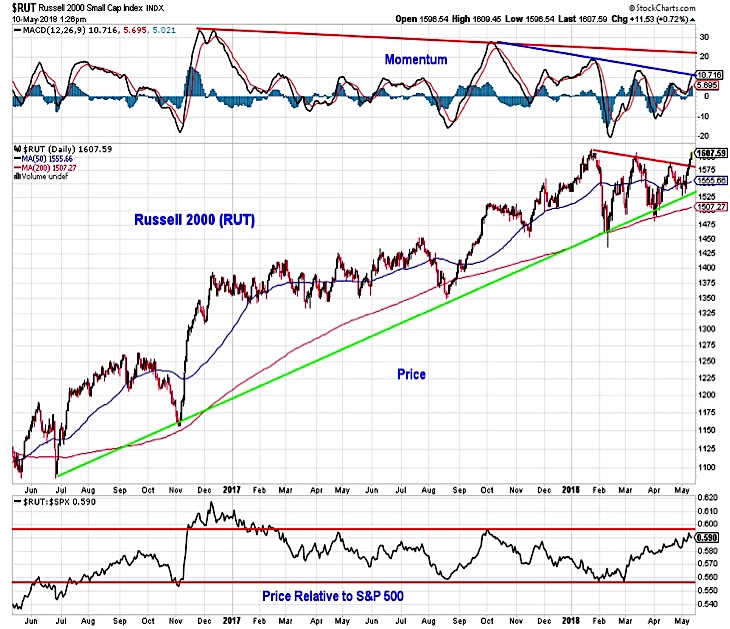
The Russell 2000 small-cap index has also rallied off of support and is clearing down-trend resistance. This sets up a test of the January all-time highs (near 1616 on the index). Definitively clearing the momentum down-trends that have emerged over the past two years would be further evidence of strength from the Russell 2000. On a relative basis, the Russell 2000 has rallied relative to the S&P 500 over the past two months and is approaching the top of the range that has persisted over the past year. Industry group trends have been favoring small-cap leadership, but seasonal headwinds are working against further small-cap strength.
We continue to look at the character of any rallies that emerge for signs that the consolidation phase may be coming to an end. Last Friday’s trading came close to providing the first 9-to-1 upside/downside volume day of the cycle, but a late day fade left it closer to 4-to-1.
Breadth thrusts are by no means mandatory, but their emergence is a reliably bullish indicator and history shows rallies that lack breadth thrusts tend to be more short-lived.
Given the move off of last week’s lows, we are again paying close attention to see if one of the various thrusts indicators fires a buy signal. The 10-day advance/decline ratio has climbed to 1.3, but remains shy of the 1.9 threshold signaling a breadth thrust.
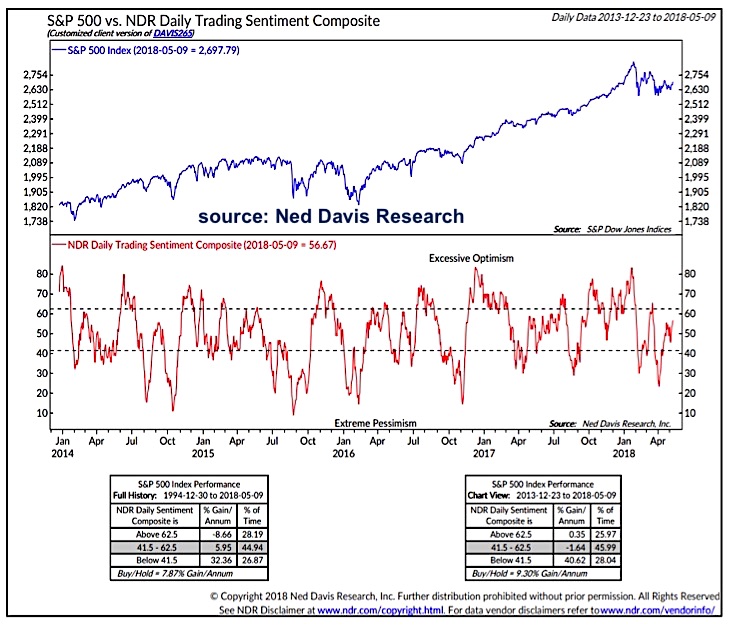
The sentiment backdrop is also unchanged. On a short-term basis, rallies remain loved and sell-offs stoke concern. Evidence of this comes from the swings this year in the NDR Trading Sentiment Composite (currently in neutral territory heading toward optimism) and in the put/call data. The CBOE equity put/call ratio moved higher as stocks weakened to open the month, but in three of the last four days we have seen readings in the 50’s (indicating complacency). We may need to see a rally that is hated or a sell-off that is not fear-inducing to produce a sustainable change in character in the market.
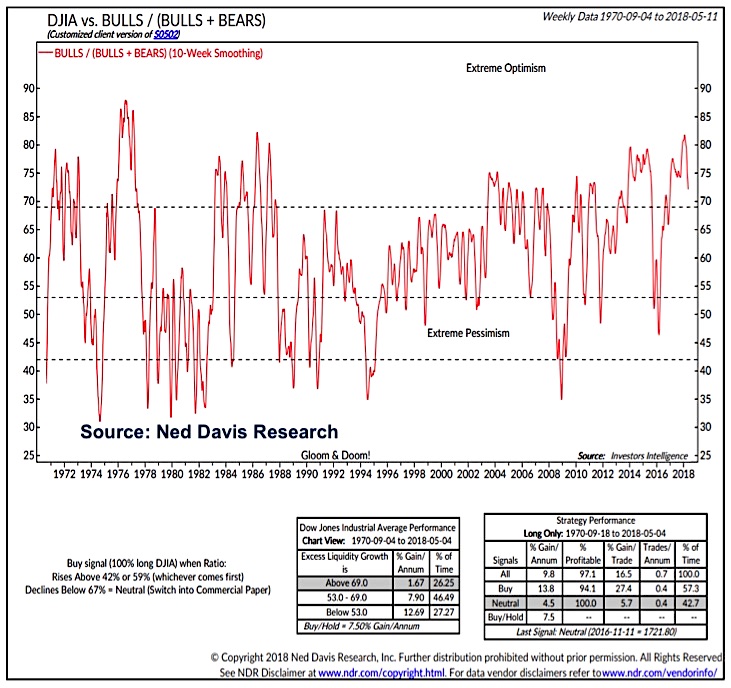
While short-term sentiment indicators have swung between optimism and pessimism this year, a longer-term look a sentiment suggests there may still be too much optimism to suggest a meaningful and sustainable market low is in place. Bulls (as a percentage of Bulls + Bears) in the Investors Intelligence survey are off of their early year high and on weekly basis, the spread between bulls and bears is at its lowest since the November 2016 election. The 10-week smoothing of the data, however, makes it difficult to suggest that from a historical perspective optimism has been fully unwound.
Twitter: @WillieDelwiche
Any opinions expressed herein are solely those of the author, and do not in any way represent the views or opinions of any other person or entity.


 Ready To Break Out?")


