The equity markets enter the final week of the second quarter sitting at or near record highs.
The S&P 500 Index (INDEXSP:.INX) and the Dow Jone Industrials (INDEXDJX:.DJI) are ahead by nearly 9.00% in 2017.
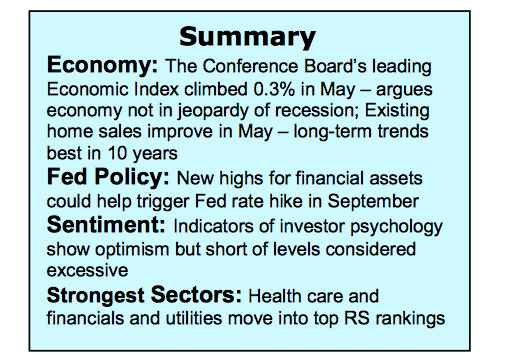
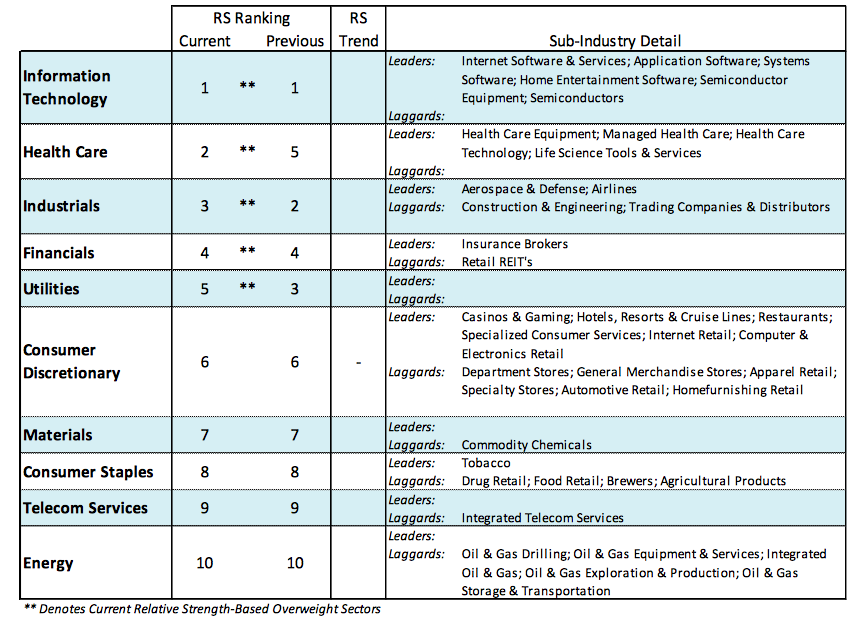
Last week, the popular stock market averages were little changed despite a drop in the energy sector following the 4.0% plunge in crude oil prices. Weakness in the oil patch was overcome by strength in health care stocks that soared 3.70% for the week and have gained 6.00% for the year. Additionally, a strong showing by the financial sector helped erase losses by the industrial and utility sectors. Since the start of the year only a handful of stocks were responsible for most of the gain in the S&P 500 Index.
The fact that other areas of the market are contributing is seen as a bullish development.
The largest concern for the two remaining quarters centers on the state of the economy and the potential for profit growth. Recent economic data has been reported below forecasts and the tailwind from profits which has been garnished in part from easy year-over-year comparisons expires in the third quarter. The feedback from the debt markets with the yield on the benchmark 10-year Treasury note falling to the low for the year along with the contraction in the yield curve argues for slower growth and inflation that was anticipated after the November election. Entering the second half of the year, the combination of supporting factors that helped propel stocks in the first half, including low inflation, low long-term interest rates and stronger growth in the global economy, are anticipated to remain key factors.
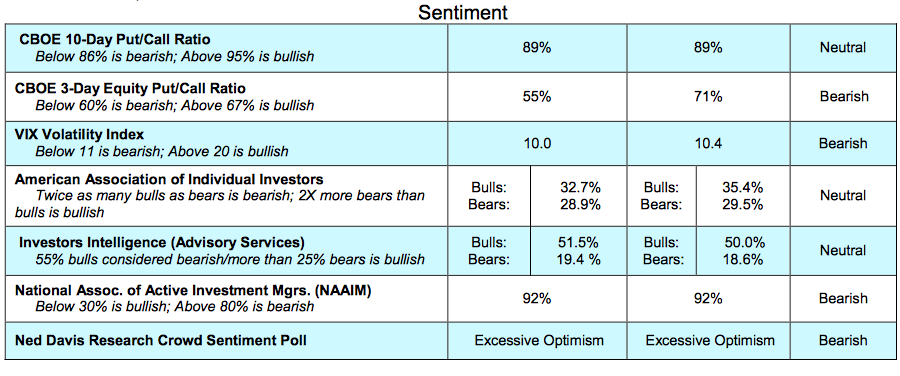
Bullish trends in equities and the underlying technical indicators argue that the financial markets are adjusting to the shifts in the economic and monetary landscape. Unlike the message from the bond market, the stock market has not abandoned the potential for stronger economic growth in 2017 and 2018. The broad market has strengthened and taken up the slack from the leading technology sector that is consolidating. This is seen in the percentage of industry groups within the S&P 500 that are in defined uptrends that has expanded to 76% from 63% in May. This is important given that the broad market typically leads the popular averages by three months or more. We would become concerned should the percentage of groups in uptrends fall below 60%. Investor psychology, which often provides an early warning signal for the stock market, has not reached a level of optimism to suggest meaningful correction is imminent.
There is, however, a widespread and deeply seated measure of complacency. Although complacency can result in a market pullback, historically it requires excessive optimism to trigger a significant and sustained decline. Over the near term, complacency cannot be ignored as the market has not experienced a meaningful drawdown in an unusually long time. Pullbacks in the first half of the year have been the shallowest since 1995 and stocks have not experienced a 5.00% correction in more than a year. The strength in the broad market suggests that any pullback would be limited in both time and price.
Thanks for reading.
Twitter: @WillieDelwiche
Any opinions expressed herein are solely those of the author, and do not in any way represent the views or opinions of any other person or entity.

: Worrisome to Broader Market?")

