The equity market’s 8-week consecutive winning streak was aborted last week with the S&P 500 Index (INDEXSP:.INX) losing 0.2%. The NASDAQ Composite (INDEXNASDAQ:.IXIC) suffered a similar fate along with the Dow Jones Industrials (INDEXDJX:.DJI) which dropped 50 basis points.
Although the popular stock market averages hit new highs early in the week fewer stocks, groups and sectors participated. This has been an ongoing trend since mid-October. And this could lead to more trouble for equities over the near-term.
More recently, diverging trends are becoming more pervasive with the Dow Transports and Russell 2000 (INDEXRUSSELL:RUT) indices moving in the opposite direction of the large-caps dominated by the S&P 500 Index. The Dow Transports are down more than 5.0% from the October high and the last time the Russell 2000 Index recorded a new high was more than five weeks ago. Further evidence of technical deterioration is that for the third consecutive week the NYSE had more stocks down than up while the NASDAQ experienced the fifth consecutive week of negative breadth.
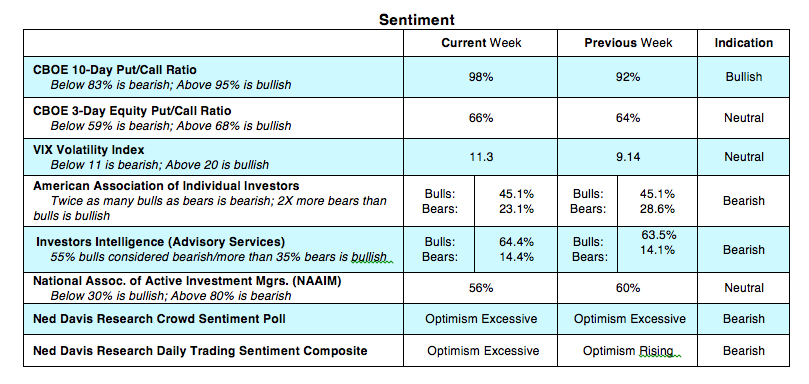
Investor sentiment indicators are also problematic. The most recent report from Investors Intelligence (II) which tracks the opinion of Wall Street letter writers shows 64% of the advisors in a bullish mode, the most since 1987. On the opposite side of the debate the percentage of bears among the advisors has fallen to the lowest level since mid-2015. This was followed by a 13% correction that carried from August to September that year. Signs of excessive optimism are also found in the latest data from the American Association of Individual Investors that shows the most bulls since the first week of the year.
Additionally, the optimism found on Wall Street extends to Main Street with consumer confidence at the highest level in 17 years. At this juncture we interpret the short-term deterioration of the stock market technicals as a reason to expect a pause or modest pullback rather than evidence of an intermediate-term breakdown in the primary trend. Strong support is anticipated to be in the vicinity of 2520 to 2555 using the S&P 500.
The economic fundamentals remain a positive force for stocks. The U.S. economy expanded at a 3.00% rate the past two quarters with consensus estimates of 4.00% growth in the fourth quarter. The ongoing rally in commodity prices, including oil, is signaling that the stronger growth now being experienced by the global economy is sustainable. This has bullish ramifications for corporate top-line expansion and profits.
The outlook for the U.S. economy, however, is clouded near term by unknowns surrounding tax reform. But the bottom line is that lower business tax rates and the repatriation of overseas profits has important ramifications given that corporate buybacks and dividends have been the principal drivers of stock prices. There is a notion that a failure to pass tax reform this year would be a blow to the stock market. This view may be overstated given the likelihood that the Federal Reserve would become less inclined to pursue an aggressive course on monetary policy should tax changes get delayed. As a result, we would view a drop in in the popular averages on negative tax-related news as a buying opportunity.
Thanks for reading.
Twitter: @WillieDelwiche
Any opinions expressed herein are solely those of the author, and do not in any way represent the views or opinions of any other person or entity.


