Most of the world stock market indexes are fractionally today, including the S&P 500 (INDEXSP:.INX). German and Italian bond yields are slightly higher, while the US Dollar (CURRENCY:USD) is largely unchanged vs most of the Majors.
Equities have failed to show the kind of upside continuation that was thought to happen after last Wednesday’s “Fed-induced”stock market rally. That said, the move has not shown much evidence of any real deterioration either.
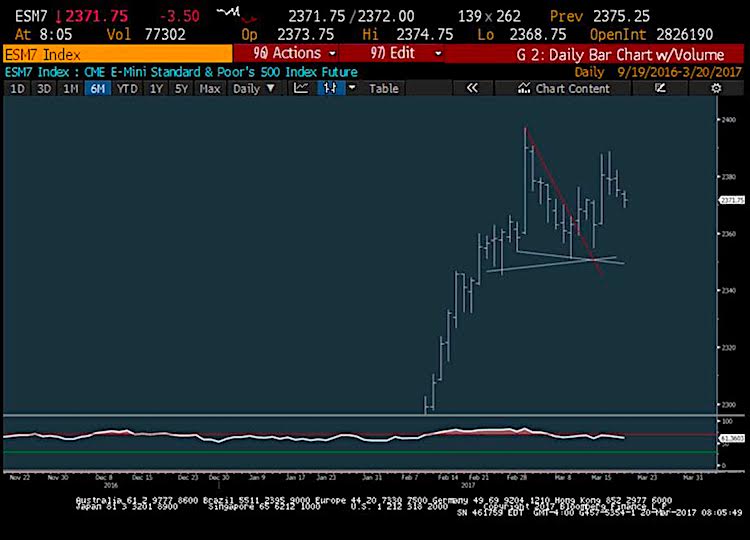
S&P 500 Futures Technical Trading Overview
Today’s early weakness has undercut last Thursday’s lows, which is a minor negative (see below). However, until/unless 2351-4 is breached on S&P 500 futures, this pullback should be an opportunity to buy as of mid-week. Furthermore, any movement back OVER 2375 on a close would be a positive and likely indicate that the rally is still “on”.
For Monday, key technical support lies at 2367-7 to buy and under this 2354-7, with a move down UNDER 2351 in June futures being a real negative.
On the upside, getting back over 2375 is positive. And both 2380 and 2385-6 bear importance over the near-term.
Elsewhere…
Commodities: WTI Crude Oil has slipped for the ninth day in 11 and Crude down largest percentage amount in march since last July. Precious metals are positive by a small amount as are Zinc and Aluminum, while the Grains are also attempting to make upside headway.
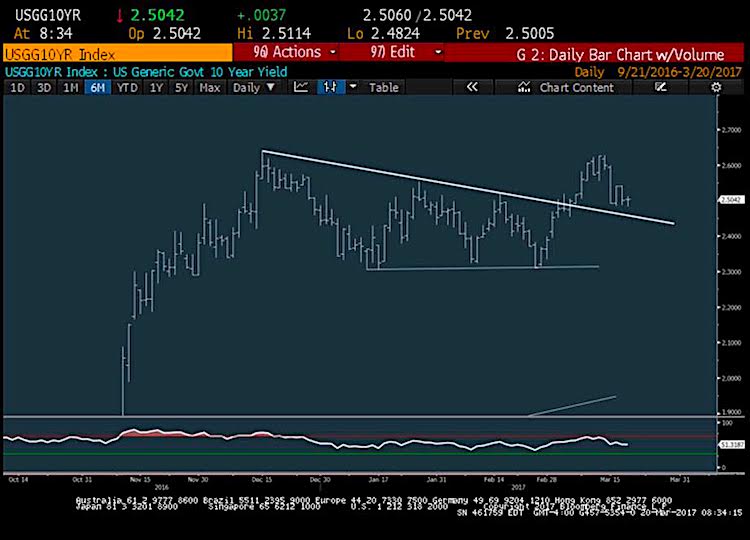
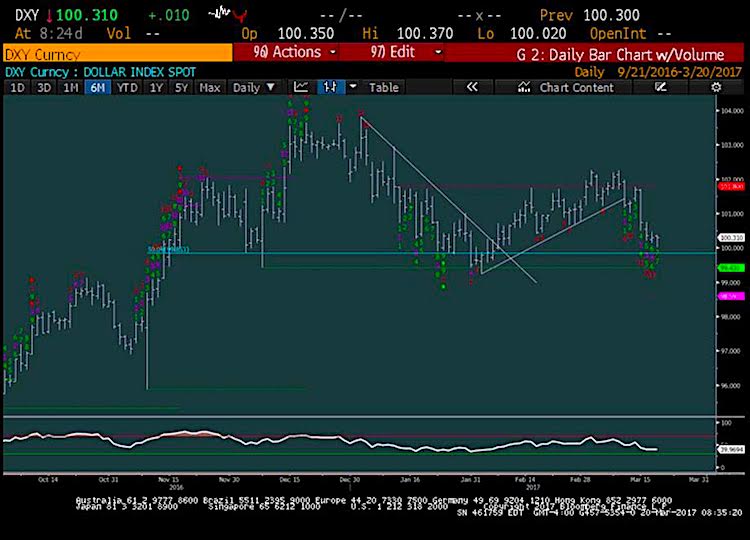
Both the US Dollar index and 10-Year Treasury yields (INDEXCBOE:TNX) are getting close to technical support after recent pullbacks, and should be on the verge of turning back higher. These are both important intermarket indicators that investors should keep an eye on.
The Dollar Index in particular has begun to show counter-trend signs of downside exhaustion, while 10 Year Treasury yields have stalled in the last few days after pulling back to important support near their own trendline.
Here’s a few charts of interest:
S&P 500 Daily Trend Chart
Bulls aren’t thrilled to see the market churning after last Wednesday’s rise. So moving back up to new highs sooner than later is quite important… especially in light of cooling breadth and momentum indicators.
However, provided that these “demarcation” lines hold at 2351 area, this pullback from late last week should still be buyable in my opinion.
10-Year Treasury Chart
Treasury yields have begun to stall after last week’s pullback and 3 straight days of sideways. They should be on the verge of turning back higher.
US Dollar Chart
The pullback in the US Dollar index should be nearly complete. Further weakness into Wednesday for the broader USD INDEX should provide opportunity to sell EUR/USD and/or buy USD/JPY for currency traders.
Note that you can catch more trading ideas and market insights over at Newton Advisor. Thanks for reading.
Twitter: @MarkNewtonCMT
Any opinions expressed herein are solely those of the author, and do not in any way represent the views or opinions of any other person or entity.


