The U.S. equity markets entered the 4th quarter at record highs, receiving a lift from stronger economic growth and renewed expectations for tax reform.
Since September 18, the S&P 500 Index (INDEXSP:.INX) has rallied less than 1.00%. Small-cap stocks, however, are ahead by nearly 4.0%.
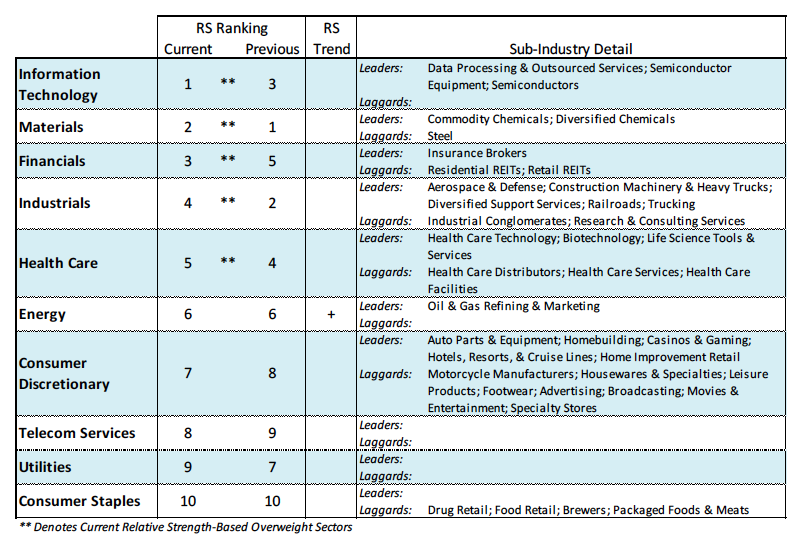
The outperformance by the Russell 2000 Index (INDEXRUSSELL:RUT) is due in part to the likelihood that tax reform will have a greater impact on small businesses. The strong showing by small cap stocks suggests that growth stocks are resuming the leadership role over value stocks. In addition to focusing on growth, investors should also concentrate efforts on those sectors that are more closely impacted by the economy including the industrials and financials. Emphasis should also be on commodity-related groups and sectors, which are exhibiting stronger relative strength than consumer sectors.
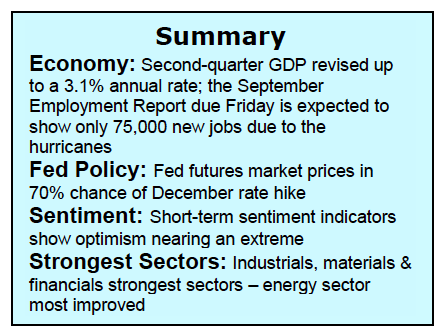
Near term the largest negative is that the new high in the popular averages has not gone unnoticed. Investor confidence has risen to levels last seen at short-term peaks in March and July. However, the fact that the equity markets powered through the traditionally weak September period suggests that the path of least resistance is to the upside. Stocks also have a seasonal tailwind as the fourth quarter is often the strongest period of the year.
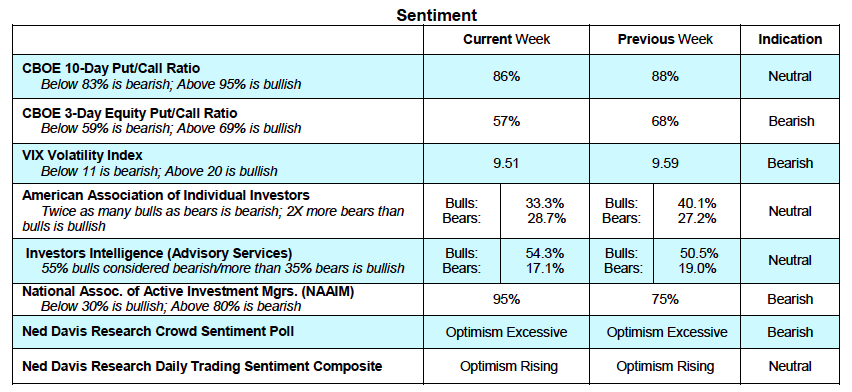
The short-term technical indicators of the stock market are mixed as market breadth continues to improve but investor sentiment has risen to levels that suggest near-term caution.
Trend indicators are decidedly bullish as Dow Transports, Russell 2000 and NY Composite indices confirm new highs by the S&P 500 and Dow Industrials.
Breadth indicators for the most part are in a bullish mode. The percentage of issues within the S&P 500 trading above their 200-day moving averages climbed to 74%, up from 63% at the August lows. The percentage of S&P stocks trading above their 50-day moving average rose to 68% from 43% last month. The percentage of the 100 industry groups within the S&P 500 that are in defined uptrends climbed to 68% last week from 50% three weeks ago. A rise in the percentage of groups in uptrends above 75% would be a bullish signal indicating that most areas are in harmony with the primary trend.
Sentiment indicators offer reason to pause near term as investor optimism is approaching levels considered excessive. Investors Intelligence (II) reports a jump in bulls last week to 54% from 47% two weeks ago and a sharp decline in the bearish camp to 17.1%. The bears have vacillated between 16.5% and 18.5% in 2017. A new low reading below 16.5% would argue strongly for caution. Excessive optimism is found in the latest data from the National Association of Active Investment Managers (NAAIM), which shows an unusually high allocation to stocks. This group of investors has a long history of missing important turns in the stock market. The CBOE reports a diminishing demand for put options. This resulted in the CBOE 10-day put/call ratio falling to 86% from 98% two weeks ago. The CBOE equity only put/call also declined last week falling into a short-term bearish mode.
Thanks for reading.
Twitter: @WillieDelwiche
Any opinions expressed herein are solely those of the author, and do not in any way represent the views or opinions of any other person or entity.

: Creating Bullish Divergence?")


: Creating Bullish Divergence?")

