Stocks broke a three-week losing streak last week and October secured its reputation as the most volatile month for equities.
The S&P 500 Index and other major U.S. equities indices had a big rally on Friday because there appears to be a sense that the U.S. and China made progress on a trade deal.
China agreed to buy more U.S. farm goods while the U.S. will hold off on placing new tariffs on Chinese goods on October 15.
This is a long process and the presidents of the U.S. and China will meet again at the APEC Summit in Chile in mid-November with the prospects of continuing the talks.
The market will continue to weigh a trade deal versus a trade war as well as recession versus steady growth.
While the U.S. economy is slowing with ISM manufacturing data weaker than expected and CEO confidence falling, we do not think we have enough indicators to point to a recession. History has shown that the economy can slow and not fall into a recession.
The trade war as well as a growing amount of geopolitical concerns (no deal Brexit, tensions in Hong Kong, South Korea and the Middle East) will pose challenges for the markets. However, we believe that a healthy labor market, consumer spending, and continued stimulus from the Fed will support the U.S. economy.
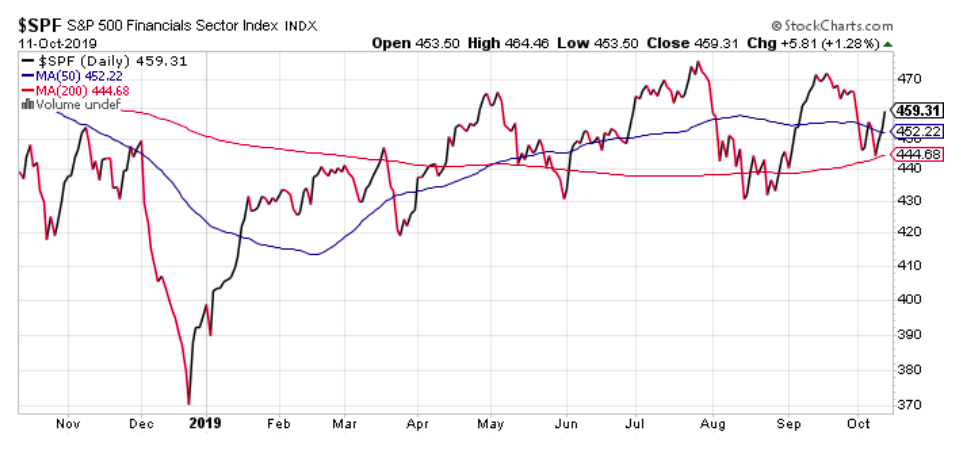
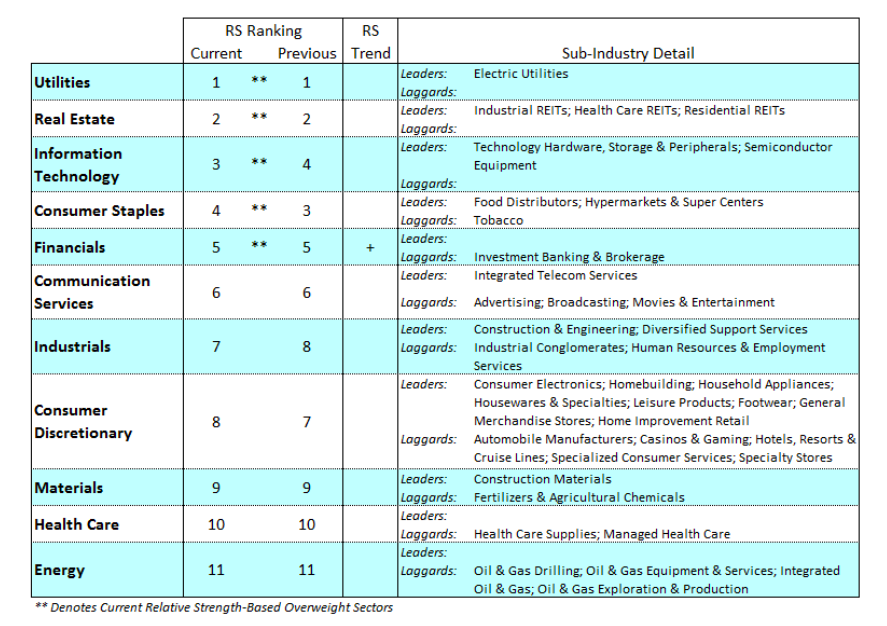
The defensive sectors of the market have been the top performers for 2019 and remain at the top of the leader board in terms of relative strength. At this juncture we encourage investors to diversify their portfolios by adding information technology and the financials sector (which has been the best performing sector the past month) as well as adding three- to five-year bonds for stability, and gold which has pulled back from recent highs. Third-quarter earnings season will open next week with S&P 500 earnings growth expected to decline 4.0% year over year. We think earnings will rebound in 2020 but at a slower pace.
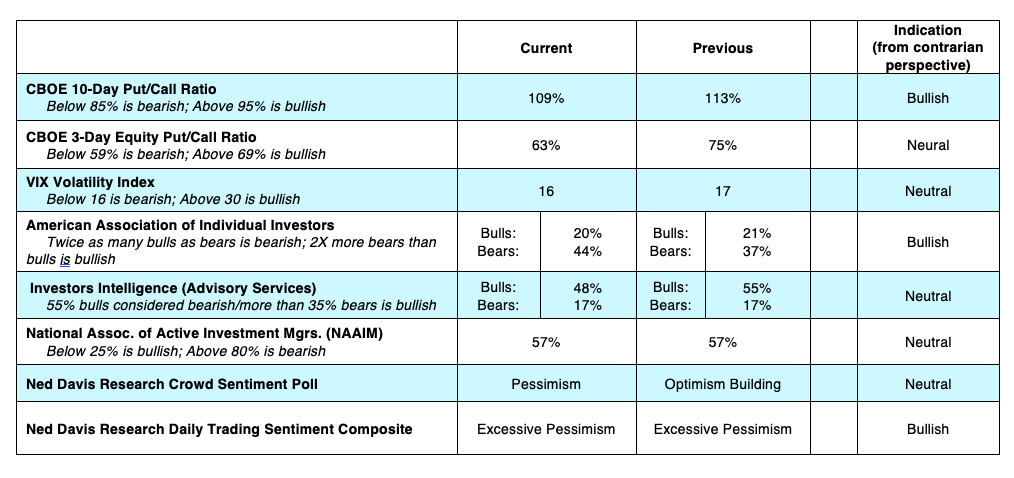
Encouragement is found by indicators that show investor sentiment is pessimistic.
Pessimism is considered a positive from a contrarian’s viewpoint and suggests that liquidity is building on the sidelines. The relatively high level of skepticism is seen in the heavy demand for put options, twice as many bears than bulls in the latest AAII survey, and the Ned Davis Daily Trading Composite which is in the excessive pessimism zone.
The broad market, however, continues with negative divergences among the popular averages with the S&P 500 Index up modestly over the past 12 months while small- and mid-cap averages are down substantially, and less than 70% of S&P 500 stocks are trading above their 200-day moving average.
In a healthy bull market, most areas are in harmony which is not the case in the present example. The technical indicators point to a continuation of the trading range environment with the risk to 2840 using the S&P 500 Index and the reward to 3020.
Twitter: @WillieDelwiche
Any opinions expressed herein are solely those of the author, and do not in any way represent the views or opinions of any other person or entity.


