The equity markets finished the week ending October 19 mixed with the S&P 500 (NYSEARCA: SPY) and Dow Jones Industrials (NYSEARCA: DIA) managing marginal gains while the NASDAQ (NASDAQ: QQQ) and small-cap stocks lost ground.
Volatility in the stock market has returned as investors balance worries over rising interest rates and global growth versus strong earnings numbers and positive economic gains.
The recently released Conference Board’s Leading Economic Index (LEI) showed, on a year over year basis, the strongest numbers since 2010, pointing to a solid economic outlook for the coming months. The LEI numbers as well as a host of economic numbers including low unemployment, rising wages and good corporate earnings suggest stocks should continue to rise.
The pullback in stock prices in October, which is often the most volatile month for stocks, should be viewed as a normal correction.
Historically, stocks vacillate 5.00% from top to bottom in any given year. The fact that the S&P 500 is down 6.00% is not far from the norm. Nevertheless, the risks have undoubtedly increased, given the trade and tariff concerns, weakness in global equity markets, and tighter monetary policy.
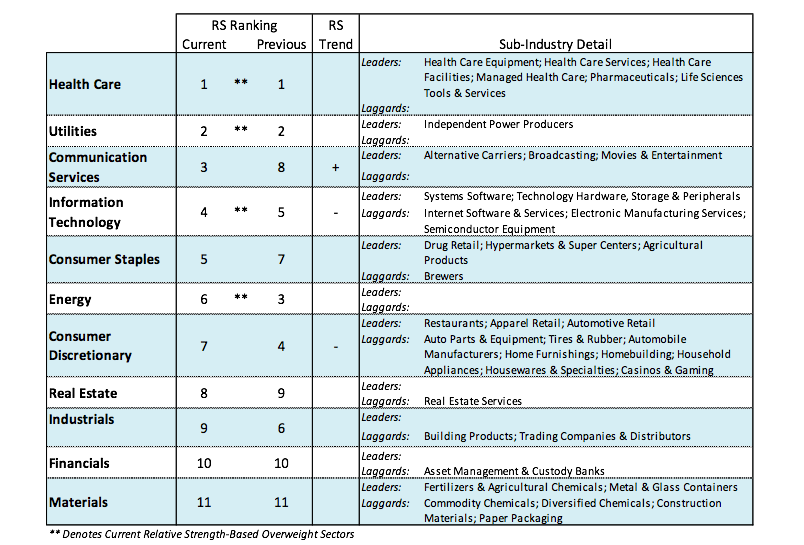
 Rising interest rates will no doubt impact consumer borrowing. Analysts are predicting a slower growth rate in home and auto sales for the coming year. FactSet projects that S&P 500 earnings will continue above 19% in the third and fourth quarters then slow to single digits in 2019. We suggest our clients refer to the Baird Asset Allocation Summary to stay with the strongest sectors of the market.

The technical condition of the equity markets continues to suggest a cautious approach. Despite the fact that the popular averages stabilized last week, stock market breadth continues to deteriorate. We are encouraged by the fact that the majority of the short-term measures of investor psychology show excessive pessimism. This is seen in the widely followed Ned Davis Daily Trading Composite that shows extreme pessimism and by the actions of often wrong options traders that have been aggressively buying put options the past two weeks expecting lower stock prices.

However, to gain confidence that a counter-trend rally is sustainable we would need to see additional evidence that a solid bottom has been reached. This would include a shift in leadership from defensive areas that currently are outperforming to cyclical and technology sectors.
On subsequent selloffs, there should be a contraction in volume that would signify that the downside pressures have subsided and that the bottoming process is underway. Signs that a market low is in place would also include a smaller number of stocks making new lows. Historically, following a market low, small-caps tend to outperform. Additionally, soon after a market low a surge in volume should occur with upside volume overwhelming downside volume by a ratio of 10-to-1 or more. This would argue that a sustainable rally is unfolding.
Twitter: @WillieDelwiche
Any opinions expressed herein are solely those of the author, and do not in any way represent the views or opinions of any other person or entity.


: Showing Some Signs of Emerging Strength")
