WHAT WLL IT TAKE FOR $5.00 CORN AGAIN?
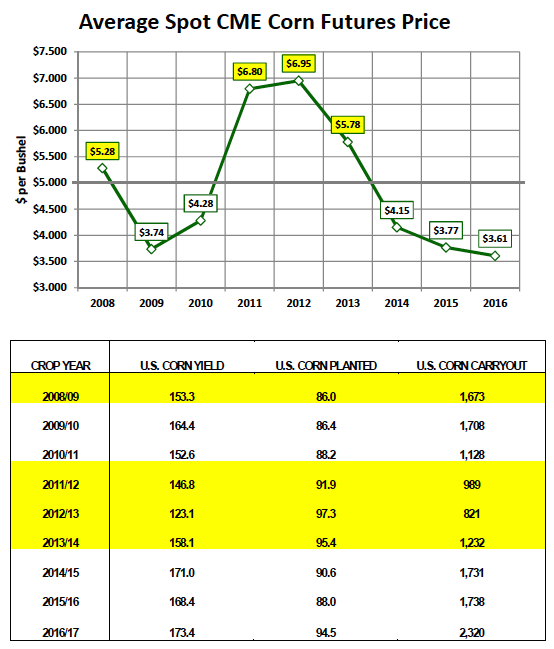
This seems to be the question I’m getting most often these days with spot CME corn futures seemingly stuck in a $3.00 to $4.50 per bushel trading range for the better of the past 29 months. In fact the last time the front-month corn futures contract traded above $5.00 was in May of 2014.
However I think if you were to ask producers they would say it feels like even longer ago than that. That said this week I’ve focused on 3 market essentials, which I believe are necessary to recreating the high corn prices producers enjoyed from 2011 – 2013.
- The most obvious cure for low corn prices is a below-trend U.S. corn yield in 2017/18. There’s no getting around the fact that the United States is far and away the largest corn producing country in the world. It’s not even close (see chart below). Even if you combined the estimated 2016/17 production totals for China, Brazil, Argentina, and Ukraine (the next 4 largest corn producing countries), they still come up 805 million bushels short of matching this crop year’s current U.S. corn production forecast of 15,057 million bushels.
Additionally, this is the 3rd consecutive year the final U.S. corn yield will likely exceed at least 168.4 bushels per acre (168.4 bpa represents the final yield from 2015/16). Prior to 2014/15, the highest U.S. corn yield on record was 2009/10’s 164.4 bpa with the average U.S. corn yield from 2007/08 – 2013/14 (excluding 2012/13’s epic yield disaster of 123.1 bpa) coming in at just 154.3 bpa. Therefore the quickest way to $5.00 corn or higher is a 2017/18 U.S. corn yield at or below 160 bpa, which isn’t exactly asking for a miracle.
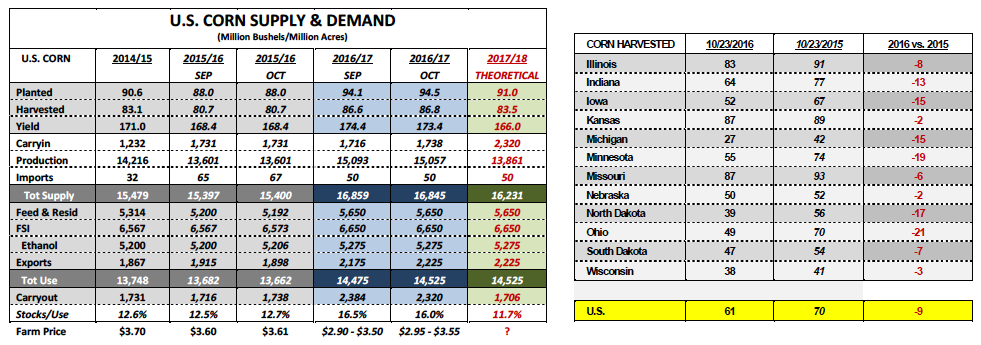
Had the 2016/17 U.S. corn yield been 160 bpa, even on the same harvested acreage base of 86.8 million acres, total production would have been 1,170 million bushels LOWER THAN today’s current October forecast. Theoretically that would have knocked the current 2016/17 U.S. carryout down to 1,150 million bushels versus the October projection of 2,320 million bushels. That’s the potential downward stocks adjustment of simply a slightly below trend corn yield over just one crop year.
- Another method to creating a tighter U.S. corn balance sheet and thereby increasing the floor in corn prices is a material reduction in 2017 planted acreage. Last week Informa Economics issued its latest 2017 U.S. corn planted acreage forecast of 91.0 million acres, which if realized would represent a 3.5 million acre reduction versus 2016. Consider the following…that type acreage decline alone would have lowered 2016/17 U.S. corn production by approximately 613 million bushels even after factoring in the USDA’s latest record corn yield estimate of 173.4 bpa. The net impact on U.S. corn endings stocks would be a carryout approaching 1,700 million bushels, which is still sufficient; however not nearly as price resistant as today’s 2,320 million bushel estimate. The other Bullish side effect of a lower planted acreage forecast is it tends to exaggerate markets fears over the possibility of spring planting delays, La Niña or any other adverse weather scenario. Lower planted acreage ultimately equates to less margin for error regarding the U.S. corn yield potentially falling below-trend.
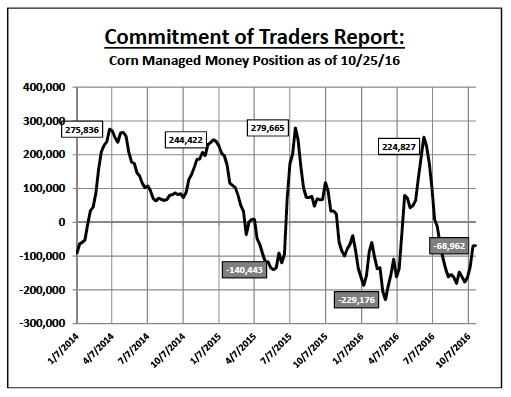
- And ultimately the best way to generate $5.00, $6.00, $7.00, and even $8.00 corn prices is a heavy Managed Money presence acting on the long side of the market. If we go back and examine when the corn market really started to gap higher into the $5.00 to $8.00 per bushel trading ranges it began in September of 2010. On September 28th, 2010 the Managed Money long in corn hit a record high of +429,189 contracts. In 2011 and 2012 the Managed Money long in corn routinely traded in excess of +300,000 contracts. In fact I find it hardly a coincidence that the 2012 calendar year high in the Managed Money long of +342,893 contracts was established just 11 days after September corn futures hit a day high and record high of $8.43 ¾ on August 10th, 2012.
At present Money Managers are still in the process liquidating a sizable NET SHORT corn position that peaked at -180,893 contracts on September 6th, 2016. Therefore, until that money flips, corn futures are going to struggle sustaining rallies. Furthermore…that money won’t likely shift aggressively long until Money Managers have a reason to get excited about corn’s upside potential and the probability of that happening remains low until my previous 2 points come back into play.
KEY PRICING CONSIDERATIONS FOR DECMEBER CORN FUTURES (CZ6)
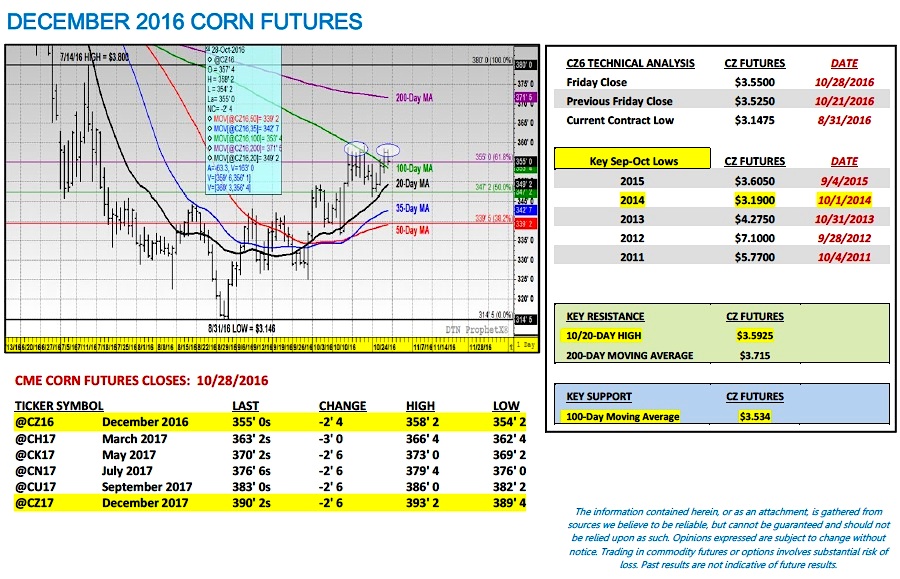
December 2016 corn futures closed 2 ½-cents per bushel higher week-on-week, closing on Friday at $3.55. For the month of October, December corn futures have managed to close 18 ¼-cents per bushel higher versus the CZ6 close on 9/30. Key considerations this week were as follows:
- Monday’s Weekly Crop Progress report showed the U.S. corn harvest improving to 61% as of 10/23 versus 70% in 2015 and the 5-year average of 62%. All 5 of the largest U.S. corn producing states have at least reached the midway point of their state specific corn harvests. Illinois’s the closest to approaching the finish line at 83% harvested. Nebraska (50%), Iowa (52%), and Minnesota (55%) all likely have a couple weeks remaining assuming the weather cooperates. Overall, the national percentage would suggest there is still approximately 5.9 billion bushels of corn left to be harvested.
- Weekly export sales in U.S. corn were 31.5 million bushels, which was slightly above the pace needed to meet the USDA’s current 2016/17-marketing year export forecast of 2,225 million bushels. Year-to-date corn sales improved to 1,240.6 million bushels versus 997.5 million a year ago as of the week ending 10/20/2016 (+24.4% year-on-year).
Technically despite December corn futures managing two consecutive closes above the 100-Day Moving Average ($3.534) on Thursday and Friday, which had been a key area of price resistance, I still believe corn futures remain decidedly range bound. I’d put the top end of the range now at $3.715 (200-Day Moving Average) with the bottom closer to $3.492 (20-Day Moving Average).
Friday’s Commitment of Traders report showed little change in the Managed Money position (see chart above), which was reported at -68,962 contracts as of the market close on 10/25 versus -69,978 the week prior. Major price moves (up or down) will now likely be deferred until Q1 2017 barring a major macro-market event (i.e. move in the Dollar Index) in November or December, which indirectly effects Ag commodity values. 2016/17 corn ending stocks, both U.S. and World, remain undeniably burdensome.
Thanks for reading.
Twitter: @MarcusLudtke
Author hedges corn futures and may have a position at the time of publication. Any opinions expressed herein are solely those of the author, and do not in any way represent the views or opinions of any other person or entity.
Data References:
- USDA United States Department of Ag
- EIA Energy Information Association
- NASS National Agricultural Statistics Service


