This was without question a tough week for Corn Bulls. Monday’s price action showcased a 15 ¼-cent lower close in December corn futures ($4.16), which resulted in CZ5 closing at its lowest level since June 29th. What is the significance of June 29th? It was the last trading day prior to the release of the June Acreage and June Stocks reports, which collectively prompted December corn futures to enter their acceleration phase to new 2015 highs when both acreage and stocks projections came in below the average trade guesses. The net result was a 29 ¼-cent higher close on June 30th with CZ5 finishing at $4.31 ½. CZ5 would eventually go on to trade up to a day high of $4.54 ½ on 7/14.
That said, the reality is that December corn futures have traded back down to essentially pre-June 30th levels, which suggests that at least a percentage of the Bullish enthusiasm that followed the release of those two key reports has now been fully digested and to a certain degree discounted.
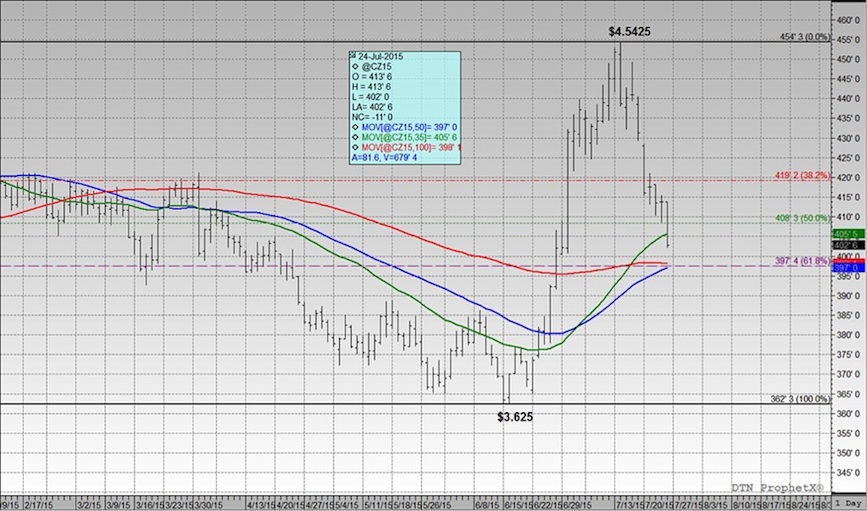
December Corn Futures – Price Chart
So, what’s changed since June 30th in the corn market that might explain the recent sharp downward correction in corn future prices? And, more importantly, what’s caused the hesitation on the part of money managers to continue adding to their long corn positions?
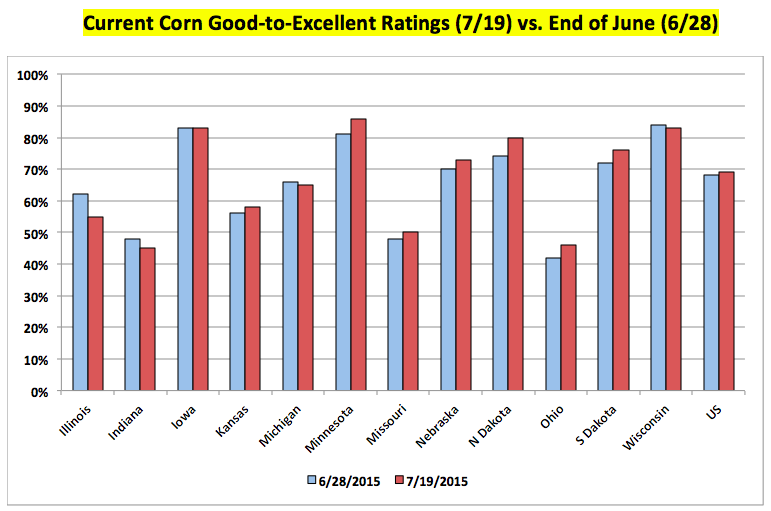
I’m a firm believer that Bull markets require nearly a daily dose of supportive news to maintain their upward momentum. In corn, if we examine closely Monday’s Crop Progress report, what we’re starting to see is that corn conditions have stabilized or improved in 8 out of the top 12 corn producing states since the end of June. In the seven states seeing an improvement (Kansas, Minnesota, Missouri, Nebraska, North Dakota, Ohio, and South Dakota), the average good-to-excellent ratings increase from 6/28 through 7/19 has been 3.7%. The two most notable improvements in that group are Missouri and Ohio for the primary reason that both states were originally seen as likely candidates for having their crop conditions continue to move backward during the month of July. Thus far that hasn’t happened with Ohio’s corn rating up 4% since June 28th and Missouri up 2%. And while it can certainly be argued that type of increase doesn’t necessarily warrant a price reaction suggesting that either state’s corn production prospects have improved dramatically, it does signal to the market that the situation has stabilized. When coupled with the very strong good-to-excellent ratings of 73% or better in Iowa, Minnesota, Nebraska, North Dakota, South Dakota, and Wisconsin, what we now have is for the first time in approximately a month a reasonable counter-punch to the pervading Bullish sentiment. A sentiment that up until this week had the majority believing the US corn yield was invariably heading for something closer to 159 to 160 bushels per acre versus a more manageable 163 to 165 bushels per acre.
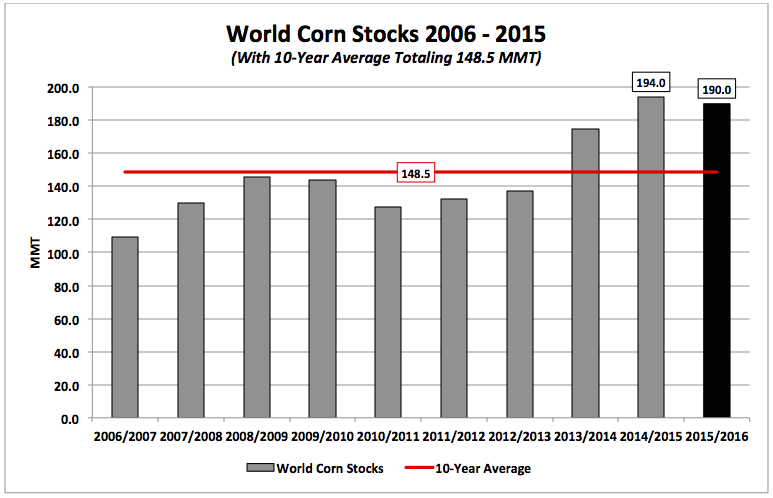
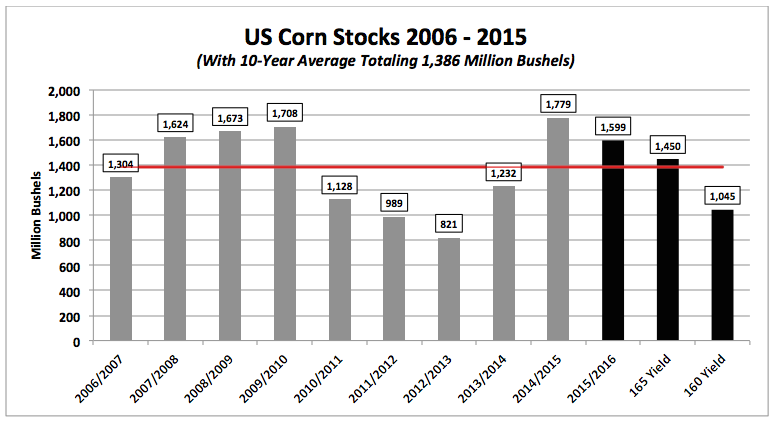
What’s the difference between a US corn yield of 165 bpa and 160 bpa? In terms of total US corn production it’s a difference of approximately 400 million bushels. As far as the carryout ramifications are concerned a yield of 165 bpa would lower the 2015/16 US corn carryout nearly 150 million bushels to 1,450 million. However, a yield of 160 bpa would lower the US corn carryout just over 500 million bushels to 1,045 million. In my opinion that’s a material ending stocks disparity with sizably different pricing implications. A US corn carryout in excess of 1,400 million bushels would still exceed the 10-year average of 1,386 million, and with World Corn Stocks currently projected at their 4th highest level in the past 28 years, I’m not sure that’s enough to justify a rally to $5.00 in December corn futures. On the contrary, if the US corn carryout continues heading in the direction of 1,000 million bushels (or if the money managers believe that type of number is still in play) a $5.00 December corn market probably isn’t out of the question.
Keeping all this in mind, I still think the key takeaway from this week is that it appears the money managers have at least for the moment paused and entertained the possibility that the US corn yield might be higher than they had previously thought or been persuaded to believe. Let’s not forget the managed money position in corn went from a net short of -120,171 contracts on June 16th to a net long of 202,747 contracts on July 14th (the largest managed money net long in corn since January 13th, 2015). That’s nearly a 323,000 contract swing in just 4-weeks. Over that same time period December corn futures traded from a day low of $3.62 ¼ on 6/16 to the aforementioned day high of $4.54 ¼ on 7/14, representing a 92-cent rally in only 20-trading sessions. I would consider that a pretty healthy recovery in a market that had previously been trending sideways to lower since essentially December 29th, 2014. Once again it’s important to point out that this shift in money flow was nearly entirely predicated on the notion that sections of the Eastern Corn Belt were going to see their harvested acreage bases reduced significantly due to excessive May/June precipitation. That fear now seems to have been marginalized. Therefore, what Corn Bulls now have to ask themselves is if the corn market seems more content with respect to being able to quantify a percentage of the bushels lost in the ECB, what new “story” then is going to surface and reignite a rally back to the recent highs? If NOAA’s updated Drought Monitor (page 5) and the latest 10 to 14-day weather forecast for the Midwest are any indication, it’s not likely to be fears about pollination temperatures and/or a lack of sub-soil moisture. Considering supply-side concerns drive summer rallies, this is a major problem for the Bulls.
For the week, December corn futures closed down nearly 29-cents per bushel and are now just over 50-cents removed from their mid-July high of $4.54 ¼. From purely a technical perspective, there isn’t much to cheer about for any remaining corn longs with CZ closing below the 50% Fibonacci retracement at $4.083, as well as, the 35-day moving average at $4.056. The next downside targets are the 100-day and 50-day moving averages, which are both consolidating in the $3.97 to $3.98 ranges. Psychologically $4.00 should also represent some form of support; however based on Friday’s price action, all bets are off when the market shifts into liquidation mode. This week serves as a reminder of how cruel and deceiving summer rallies can be. As is often the case in July, the market doesn’t give you a few days to digest what might be the first signs of exhaustive type price action. Just 9 trading sessions ago traders were contemplating a run to $5.00 on December corn futures; now that euphoria has been replaced with fears of a possible return back to the mid-June lows near $3.62 per bushel. Next week is very important for the corn market… the 100-day needs to hold on Monday and Tuesday to stop the bleeding.
Thanks for reading and have a great week.
Twitter: @MarcusLudtke
Data References:
- USDA United States Department of Ag
- EIA Energy Information Association
- NASS National Agricultural Statistics Service
Any opinions expressed herein are solely those of the author, and do not in any way represent the views or opinions of any other person or entity.

: Worrisome to Broader Market?")

