There were very few surprises in the USDA’s October WASDE report, which was released on Wednesday (10/12).
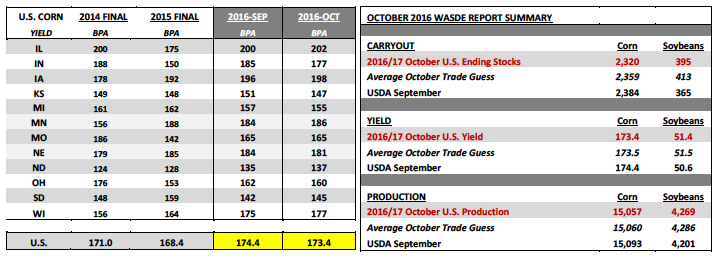
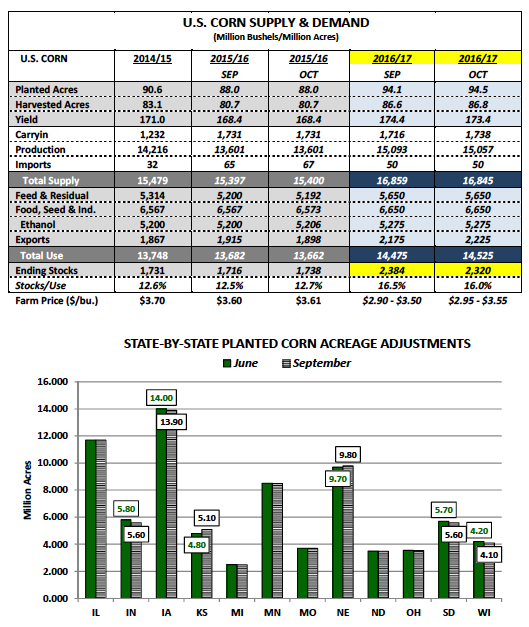
As far as notable supply-side changes to the 2016/17 U.S. corn balance sheet, the USDA did lower the national corn yield 1 bushel per acre versus September to 173.4 bpa. This was essentially equal to the average trade guess of 173.5 bpa. The yield decline was partially offset by a slight uptick in planted corn acreage, which increased to 94.5 million acres (+340,000 acres versus the USDA’s June 30th estimate). The net impact on total U.S. corn production was a minor and inconsequential downward adjustment of just 36 million bushels in the October WASDE report (versus a month ago).
On the demand side of the equation, the USDA did increase its U.S. corn export projection another 50 million bushels to 2,225 million. If realized, it would be the largest export figure since 2007/08’s 2,437 million bushels. The culmination of the USDA’s adjustments resulted in a revised 2016/17 U.S. corn carryout estimate of 2,320 million bushels versus 2,384 million bushels in September (with the average trade guess of 2,359 million). Find WASDE reports here.
Was there anything in the October WASDE report to justify the substantially higher price action in December corn futures on Thursday and Friday?
No. If anything I found it more Bearish than the September WASDE report a month ago. I say this because the USDA had access to more actual harvested acreage data, specifically for the Eastern Corn Belt. As of Monday’s (10/10) Weekly Crop Progress report, 62% of Illinois’s corn crop had been harvested versus just 51% on average. In the USDA’s latest state-by-state corn yield estimates they raised Illinois’s corn yield to a record 202 bpa. This was up 2 bpa versus a month ago and was also 2 bpa better than IL’s prior record yield from 2014. With Illinois’s corn harvest rapidly approaching completion I think a potentially Bullish argument (lower ear weights equal lower state corn yields) is losing serious traction.
There were declines to both Indiana’s and Ohio’s state corn yield estimates (down 8 bpa and 2 bpa respectively); however the net result was a combined total production decrease of only 86.9 million bushels. Furthermore after factoring back in 2 bpa state corn yield increases for Illinois, Iowa, and Minnesota (3 or the 4 largest state corn producers in the country) there just wasn’t that consistent thread of lower yield projections in several key corn producing states that Corn Bulls were hoping to find in the October WASDE report. In fact the USDA’s current 2016/17 total U.S. corn production estimate of 15,057 million bushels remains a record by an incredible 841 million bushels (14,216 million bushels in 2014/15).
The World Corn S&D figures also offered very few surprises. 2016/17 World corn ending stocks were reduced 2.7 MMT month-on-month to 216.8 MMT; however that estimate still represented a record high by 6.7 MMT. Brazil’s 2016/17 corn production forecast was raised to 83.5 MMT versus just 67.0 MMT in 2015/16 (an increase of 650 million bushels). However it should be noted that at present Brazil remains in the process of planting its full-season corn crop for 2016/17 (approximately 50% planted) with its safrinha corn crop not seeded until February at the earliest (after Brazil’s soybean harvest). Therefore the USDA’s October production forecast is entirely predicated on the assumption of a return to trend-line to slightly above trend-line corn yields for the 2016/17 crop year.
DECEMBER CORN FUTURES PRICE FORECAST
Key CZ6 Pricing Considerations For The Week Ending 10/14/2016:
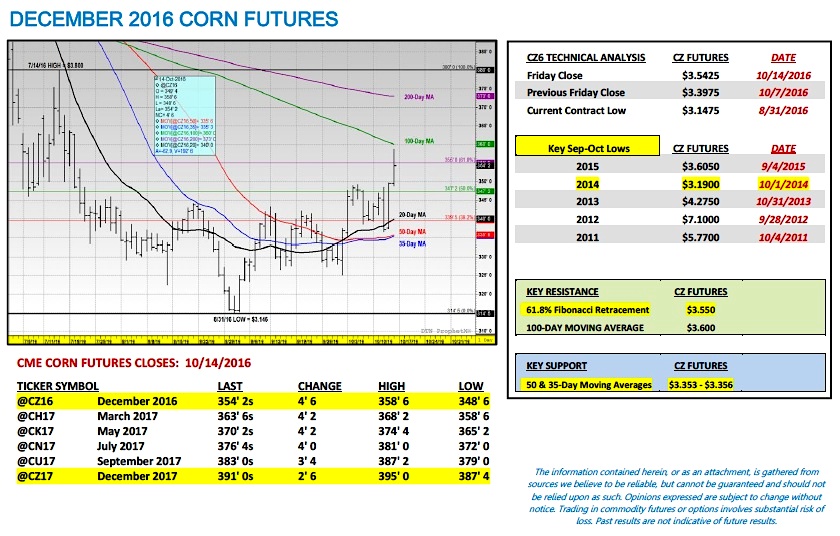
December 2016 corn futures closed 14 ½-cents per bushel higher week-on-week, closing on Friday at $3.54 ¼. This represented the highest close in CZ6 since July 18th, 2016 ($3.63 ¼). That said with the October WASDE report offering no fundamental justification for a Bullish price response, what other factors possibly inspired the sharply higher weekly corn close?
- Monday’s Weekly Crop Progress report showed the national corn harvest at 35% as of 10/9. If we factor in additional harvest gains made since then it’s likely the U.S. corn harvest now exceeds 50%, which invariably means there is less commercial hedge (sell) paper to neutralize intermediate rallies.
- The impact of less commercial hedge paper (see point 1) has become even more evident with Money Managers starting to square their massive net corn short. The Managed Money position decreased to -130,973 contracts as of the market close on October 11th, 2016 with Money Managers weekly buyers of +31,885 contracts.
Despite this week’s up move, I still view continuation rallies up to key resistance as selling opportunities over the next 30-days. The 100-day moving average at $3.59 ½ to $3.60 should serve as once such area followed by the 200-day moving average at $3.727.
Thanks for reading.
Twitter: @MarcusLudtke
Author hedges corn futures and may have a position at the time of publication. Any opinions expressed herein are solely those of the author, and do not in any way represent the views or opinions of any other person or entity.
Data References:
- USDA United States Department of Ag
- EIA Energy Information Association
- NASS National Agricultural Statistics Service


