The tug of war between bulls and bears in the corn and soybean market continued this week with the focus almost entirely on South American weather developments. And how this might affect the corn crop and soybean crop.
Regarding Argentina’s soybean crop, the magnitude of the bushels lost due to extensive flooding during the month of April remains a sizable unknown. Therefore, as it stands a trader can read what he or she wants to regarding potential production decreases with estimates currently ranging from a minimum of 2 MMT (-74 million bushels) to a maximum of 10 MMT (-367 million bushels).
Obviously that type of excessive range only fuels additional price uncertainty leading into next Tuesday’s May 2016 WASDE report. In April the USDA estimated Argentina’s 2015/16 soybean crop at 59 MMT.
As far as Brazil’s safrinha corn crop is concerned, which continues to be negatively impacted by persisting drought-like conditions, private production forecasts have been lowered to 48.9 to 52.5 MMT versus 54.6 to 56.6 MMT a month ago. In April the USDA projected Brazil’s total 2015/16 corn crop at 84 MMT with approximately 65-67% of that figure attributable to safrinha production. Therefore I wouldn’t be surprised to see the USDA lower its total production estimate 2 to 3 MMT (-79 to -118 million bushels) in the May WASDE report; however I’m not expecting them to go any further at this time. The USDA has an established historical precedent of patient, calculated production adjustments as opposed to the alternative, which can be emotional and often unsubstantiated monthly increases or decreases. Have there been exceptions to this? Absolutely, however considering the majority of Brazil’s safrinha corn harvest remains 1 to 3 months away, the “wait and see” approach seems to be the safer play for the USDA in this report.
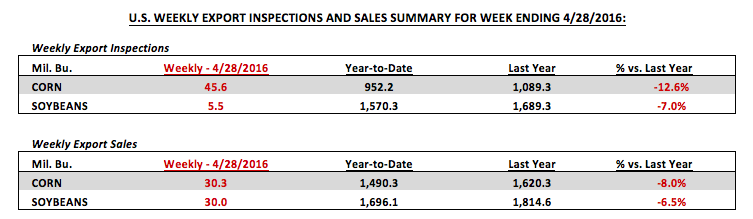
In this week’s U.S. export inspections and sales summaries for the week ending 4/28, the corn numbers were once again indicative of an improving demand market. Weekly corn shipments totaled 45.6 million bushels with sales eclipsing 30 million bushels for the second consecutive week. Year-to-date U.S. corn export sales continue to trail 2014/15’s pace by 8%; however that gap has narrowed considerably in just the past two weeks. I believe strongly the recent surge in exports still supports a minimum 50 million bushel increase to the USDA’s 2015/16 U.S. corn export projection in the May WASDE report. One week of above-average sales certainly doesn’t define a trend; however two weeks potentially does, especially when it’s followed up by actual shipments. It’s apparent that Japan, South Korea, and others are taking real precaution against further production cuts to Brazil’s corn crop.
Weekly U.S. soybean export sales also had a very good showing coming in at 30.0 million bushels, which was up substantially from the previous week. Year-to-date sales improved to 1,696.1 million bushels versus 1,814.6 million a year ago (down 6.5%). Will the USDA raise 2015/16 U.S. soybean exports in the May WASDE report? I would argue it’s likely; however the increase could be more measured considering the USDA just increased its projection 15 million bushels from March to April. That said based on the continued production unknowns concerning Argentina, as well as, some private analysts now also penciling in a 98 to 99 MMT 2015/16 Brazilian soybean crop versus the USDA’s April projection of 100 MMT, another 10 to 15 million bushel export increase seems appropriate.
What other major U.S. corn Supply & Demand areas will the market be focused on in the May 2016 WASDE Report? The May Crop report carries with it added significance due to it containing the USDA’s first official 2016/17 U.S. corn supply and demand table. For months traders have been speculating on what that balance sheet might look like and on Tuesday we’ll finally get some answers. I put together a list of what I believe to be the major points of emphasis for this report.
The three most critical figures in the UDSA’s U.S. corn Supply & Demand tables will be the 2015/16 U.S. corn carryout, the 2016/17 U.S. corn yield, and the 2016/17 U.S. corn carryout.
- 2015/16 U.S. Corn Carryout: The trade is already anticipating a decrease to the old-crop carryout by virtue of an increase to exports. The only question being, “How big of a cut will the USDA make?” The average trade guess for ending stocks currently stands at 1,841 million bushels versus 1,862 million in April. However I believe that figure will be closer to 1,800 million due to a 50 million bushel increase to exports. That still provides an ample carryin stocks projection for 2016/17. U.S. corn carryin stocks for the past 3 crop years were 1,731 million bushels (2015/16), 1,232 million bushels (2014/15), and 821 million bushels (2012/14). A beginning stocks estimate over 1,800 million would be the largest since 2006/07 (1,967 million bushels).
- 2016/17 U.S. Corn Yield: I’m expecting a figure very close to 168 bushels per acre, which was the number the USDA plugged in its S&D model at the Ag Outlook Forum back in February. It should be noted that in 2015 the USDA started at a yield of 166.8 bpa in the May report versus 165.3 bpa in 2014. However considering the U.S. has achieved final national corn yields in excess of 168 bpa in each of the last two corn crop years, I’m of the strong opinion the USDA will lean more toward a slightly above-trend yield projection in Tuesday’s report.
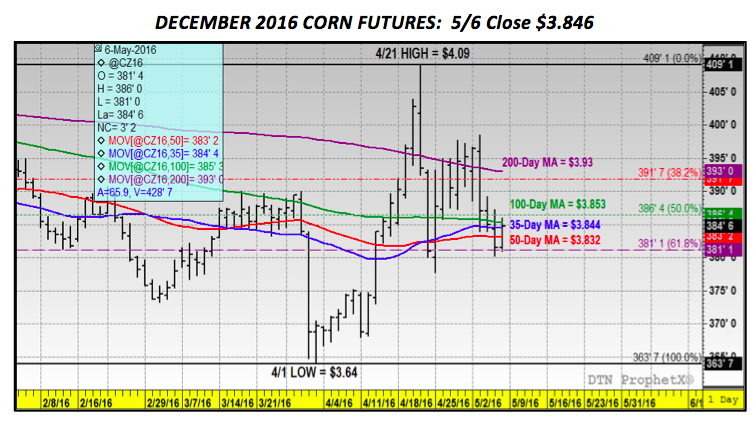
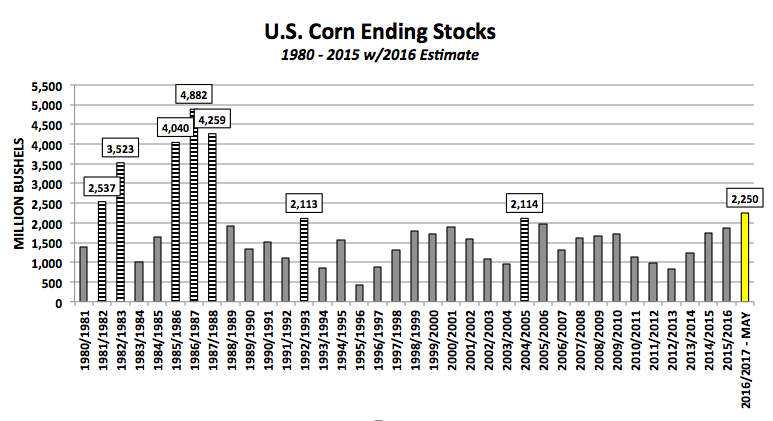
- 2016/17 U.S. Corn Carryout: This is where the fundamental defense for continued corn rallies above the CZ6 high of $4.09 from 4/21 gets difficult for Corn Bulls. Considering the market already knows the planted acreage estimate will be 93.6 million acres (via the March Prospective Plantings report), if carryin stocks are 1,800 million bushels and the USDA uses a yield of 168 bpa, 2016/17 total U.S. corn supplies will exceed 16,250 million bushels. Therefore even if the USDA chooses to increase 2016/17 total U.S. corn demand 500 million bushels year-on-year, the 2016/17 U.S. corn carryout still pencils back at more than 2,250 million bushels. This would represent the largest U.S. corn carryout since 1987/88! Furthermore I’ve seen recent private estimates as high as 2,500 million bushels. The only way I currently see Corn Bulls being able to shift the market’s attention away from next Tuesday’s initial 2016/17 U.S. corn ending stocks estimate is for them to try and immediately discount the USDA’s yield forecast of 168 bpa due to the much publicized possibility of a late growing season La Nina weather event.
Corn Prices & Considerations:
December corn futures closed on Friday at $3.84 ¾ per bushel, down 10 ½-cents week-on-week. That said how corn futures start the week will be very important for Corn Bulls. CZ6 is currently sandwiched between the 100-day ($3.853) and 50-day ($3.832) moving averages. Therefore a lower close on Monday and Tuesday will do some serious technical damage to the recent uptrend. As I stated above, Corn Bulls will need a lot of outside help to survive what is expected to be an undeniably Bearish 2016/17 U.S. corn carryout in Tuesday’s May WASDE report. That “help” could come from either a greater than expected cut to Brazil’s corn crop and/or a surprisingly Bullish U.S. 2016/17 soybean S&D.
Thanks for reading.
Twitter: @MarcusLudtke
Author hedges corn futures and may have a position at the time of publication. Any opinions expressed herein are solely those of the author, and do not in any way represent the views or opinions of any other person or entity.
Data References:
- USDA United States Department of Ag
- EIA Energy Information Association
- NASS National Agricultural Statistics Service


