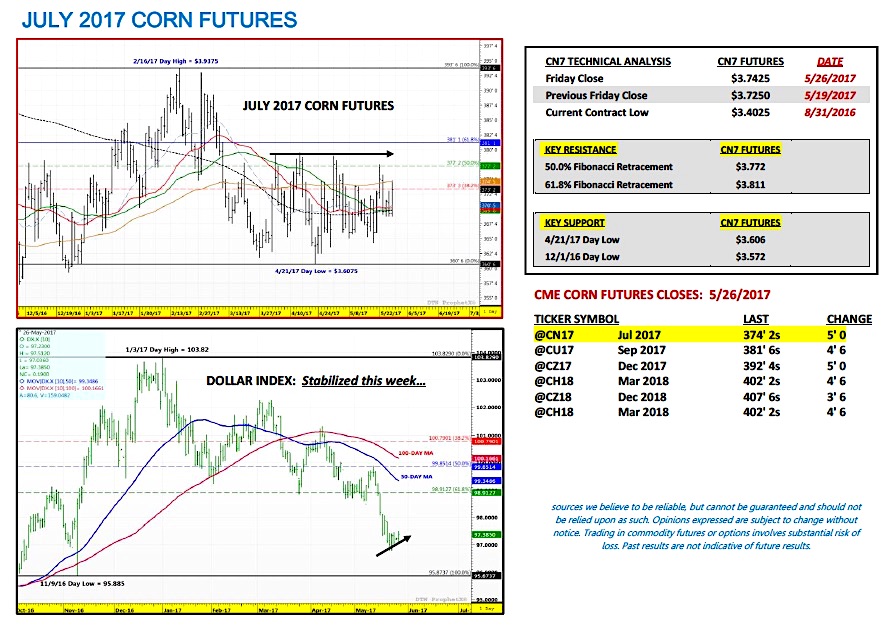
July corn futures moved slightly higher this week, closing up 1 ¾-cents per bushel week-on-week, finishing on Friday (5/26) at $3.74 ¼.
Corn futures battled back impressively once again on Friday to close higher on the week; however were unable to close over key resistance at the 100-day moving average at $3.74 ½.
Weekly Corn Price Drivers (5/22/17 – 5/26/17)
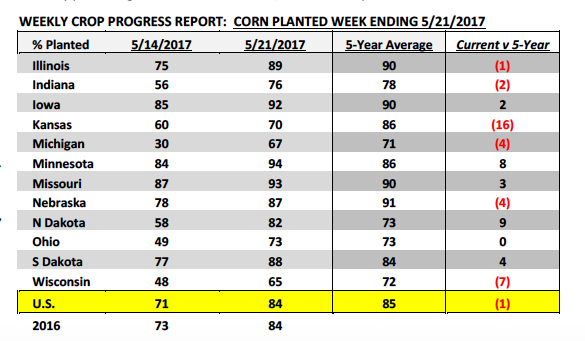
- U.S. Corn Planting Progress: Monday’s Crop Progress report showed the U.S. corn crop now 84% planted as of May 21st versus 84% in 2016 and the 5-year average of 85%. The top 4 U.S. corn producing states, which collectively accounted for 54% of total U.S. corn production in 2016/17, were at least 87% planted or greater (Iowa 92%, Illinois 89%, Nebraska 87%, and Minnesota 94%). Therefore any remaining market premium in corn prices associated with the uncertainties regarding the pace and timing of spring planting has likely been extinguished (or will be). Furthermore the USDA also reported corn emergence at 54% nationally versus last year’s 58% and the 5-year average of 55%. That said thus far into the 2017 growing season, albeit still not even June with plenty of weather-related obstacles remaining, Corn Bulls really haven’t had too much to gravitate to in the form of a legitimate U.S. supply side concern.
- China DDGS Imports: This week China reported April DDGS imports of only 51,523 metric tonnes; which was down 80% from 2016. Additionally year-to-date Chinese DDGS imports improved to just 246,155 metric tonnes, 77% below 2016. China’s anti-dumping duties for DDGS ranging from 42.2% to 53.7% have had a massive effect on the U.S. DDGS export market. In 2015 the U.S. exported nearly 6.5 MMT of DDGS to China (51% of total U.S. DDGS exports). That figure fell to just 2.4 MMT in 2016. And clearly 2017 U.S. DDGS exports are now in a position to fall even further. This invariably has forced more U.S. DDGS back into the domestic market, which has resulted in historically depressed prices (currently trading from $85 to $95 a ton in MN/IA, FOB ethanol plant origins). And since DDGS displace a certain amount of U.S. feed corn demand, lower DDGS prices have also been a contributing factor to overhead price resistance in corn futures. I wouldn’t suggest cheap DDGS are necessarily preventing rallies in the corn market, but rather they are a consideration when it comes to feed substitution values at certain pricing points.
- Weekly Export Sales: Export sales of corn for the week ending 5/18/2017 totaled 18.0 million bushels, 33% below the prior 4-week average. Crop year-to-date (2016/17) U.S. corn export sales increased to 2,096.6 million bushels. The USDA’s May WASDE forecast for 2016/17 U.S. corn exports was unchanged at 2,225 million bushels. Therefore with 15 weeks to go in the 2016/17-marketing year (which ends on August 31st), U.S. corn export sales need only average 8.6 million bushels per week to meet the USDA’s current estimate. Even though that feels like an easily attainable weekly average, I still don’t expect the USDA to increase their 2016/17 U.S. corn export projection in the June WASDE report (released on 6/9/17). The recent downward trend in U.S. sales strongly suggests Brazil’s record large safrinha corn crop is starting to make its way into the world market.
Key Pricing Considerations For July Corn Futures Trading
Key takeaways from this week’s price action:
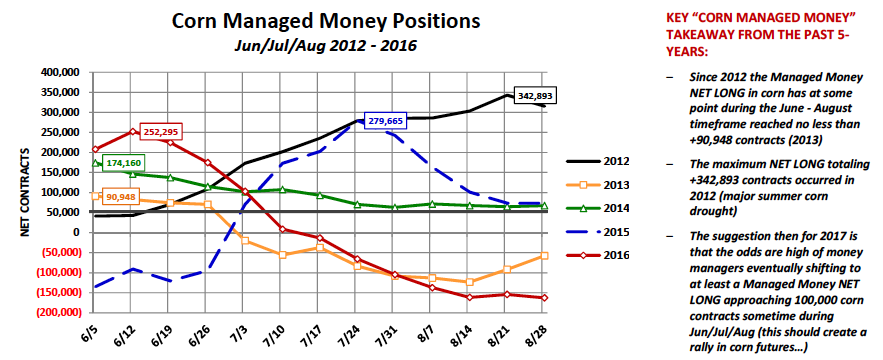
- COT Report: Corn Managed Money Positions – This week I spent considerable time looking at the Managed Money positions in corn during the June, July, and August timeframe in each of the past 5-years. Upon review there’s a fairly undeniable trend, which is at some point during the “summer” months money managers shift to carrying a long position in corn. The maximum Managed Money net LONG in corn ranged from a low of +90,948 contracts in 2013 to a high of +342,893 contracts in 2012. The key takeaway however is simply… money managers are currently still carrying a massive net SHORT position in corn (-176,503 contracts). That said history would suggest this won’t last during the summer and at some point that money will shift to the long side of the market. It’s worth noting as well that the last 5-years has been comprised of a wide diversity of growing seasons (record high corn yields/total production, as well as, devastating yield reducing summer droughts) and yet time after time money managers have still gravitated to the long side of the market during June, July, or August.
- The weekly pricing pattern in corn over the last 4-weeks has been for July corn futures to close higher on Friday. Additionally 3 out of 4 of those Friday sessions (5/5, 5/19, and 5/26) resulted in July corn futures closing at least 4 ¼-cents higher that afternoon. However the challenge has been for corn futures to build on those Friday gains the following Monday and Tuesday. Thus far that hasn’t happened and were it not for the strong closes on Friday corn futures would have in most cases closed lower week-on-week. That said looking ahead to next week…Corn Bulls need to see a continuation of Friday’s strong close when the market opens on Tuesday morning. Technically the stars have aligned momentarily with CN7 closing decisively above the 20, 35, 50, and 200-day moving averages on 5/26. Therefore all that remains is a close above the 100-day moving average at $3.74 ½, just ¼-cent above the 5/26 close. If and when this happens Money Managers will likely look to cover more of their approximate -170,000 contract corn short, which could provide the fuel for a rally back over $3.85 in July corn futures and $4.00-$4.05 in December corn.
Thanks for reading.
Twitter: @MarcusLudtke
Author hedges corn futures and may have a position at the time of publication. Any opinions expressed herein are solely those of the author, and do not in any way represent the views or opinions of any other person or entity.
Data References:
- USDA United States Department of Ag
- EIA Energy Information Association
- NASS National Agricultural Statistics Service


 Analysis: Bulls Eye Down-Trend Line")


