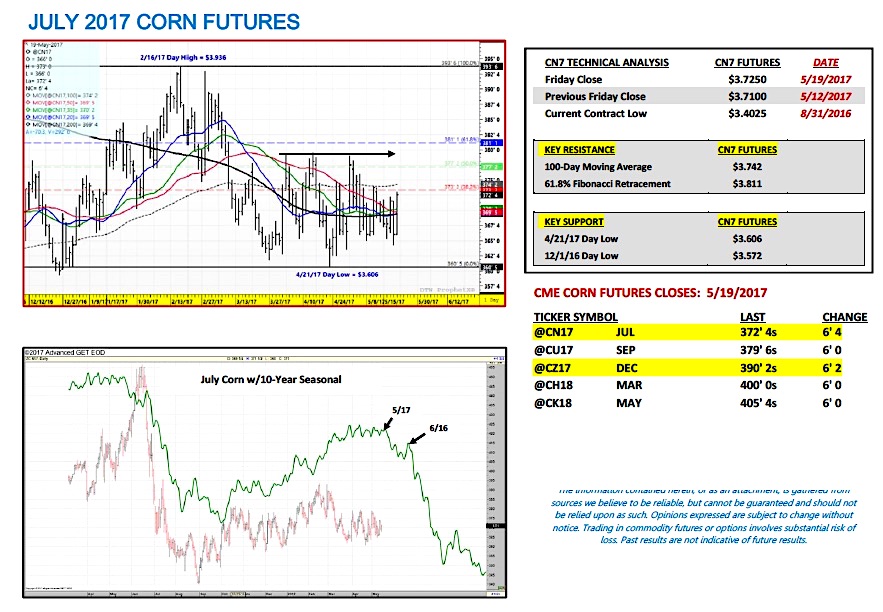
July corn futures moved slightly higher this week, closing up 1 ½-cents per bushel week-on-week, finishing on Friday (5/19) at $3.72 ½.
Corn futures battled back impressively on Friday to close higher on the week despite largely negative market forces pressuring prices Monday through Thursday.
Weekly Corn Price Drivers:
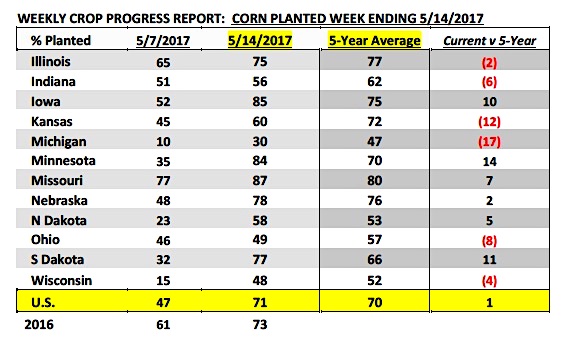
U.S. Corn Planting Progress: Monday’s Crop Progress report showed the U.S. corn crop now 71% planted as of May 14th versus 73% in 2016 and the 5-year average of 70%. So much for that perceived spring planting delay, specifically for the Western Corn Belt. Iowa’s corn planting progress improved to 85%, nearly equal to the 87% planted in 2016 and ahead of its 5-year average of 75%. Minnesota made the largest week-on-week planting gain with 84% of its corn crop now planted versus just 35% a week ago. The 84% did still trail the record pace established a year ago (92% planted as of 5/14); however Minnesota is now well ahead of its 5-year average of 70%.
I’ve said it time and time again…the spring planting delay rally is no longer sustainable. With Minnesota as the prime example this year, an incredible 49% of Minnesota’s 8 million intended corn acres were planted in 7-days. Bottom-line farmers can plant their crops in a very small window of time if necessary due to the obvious advancements in planting equipment. For that reason alone chasing spring planting delay rallies hasn’t proven a winner over the last several crop years. More importantly long-term as it relates to corn yield optimization, Corn Bulls now have little to no argument remaining for this year’s corn crop not being planted early enough to achieve a record corn yield. At 71% planted, the U.S. is just 2% behind last year’s pace, which produced the current record U.S. corn yield of 174.6 bpa. Furthermore the U.S. is actually ahead of the 2014/15-crop year, which wasn’t 71% planted until May 17th. The 2014/15-crop year represents the only other time the U.S. corn yield has exceeded 170.0 bpa (171.0 bpa).
The U.S. Dollar Index sold off aggressively this week (through Wednesday) trading back down to its lowest level since November 9th, 2016. The Dollar Index and U.S. commodity values have traditionally maintained an inverse pricing correlation. More specifically then as it relates to the presumed present-day market influence as the Dollar Index breaks, U.S. commodity futures should appreciate in value due to U.S. exports becoming more price competitive in the world marketplace. That said thus far I haven’t seen corn futures respond upward despite this recent downward acceleration in the Dollar Index. Additionally weekly U.S. corn export sales were just 27.8 million bushels for the week ending 5/11/17, only 1% higher than the prior 4-week average. Therefore a “weaker Dollar” has yet to provide the price support Corn Bulls were hoping for.
Thursday’s meltdown in soybeans and corn was due to a combination of factors. Soybeans traded sharply lower following a breaking story concerning the President of Brazil, Michel Temer, reportedly encouraging a businessman to continue paying a jailed former House Speaker (Eduardo Cunha) for his silence. That sent the Brazilian real spiraling downward in value, which in turn prompted Brazilian farmers to start selling a large percentage of their record 2016/17 soybean harvest totaling 111.6 MMT (cheaper Brazilian real equates to higher domestic soybean prices and more attractive Brazilian soybean exports). The impact on the CME was immediate. November soybean futures traded down to as low as $9.42 ¼, coming very close to matching the current 2017 day low of $9.41 ½ from 4/11/17. I believe the weakness in soybeans then spilled over into the corn market as well.
Pricing Considerations For Corn Futures Traders This Week: July corn futures (CN7) closed on Friday (5/19) at $3.72 ½ finishing up 1 ½-cents per bushel week-on-week.
Key takeaways from this week’s price action:
Corn futures remain resilient for two key reasons in my opinion.
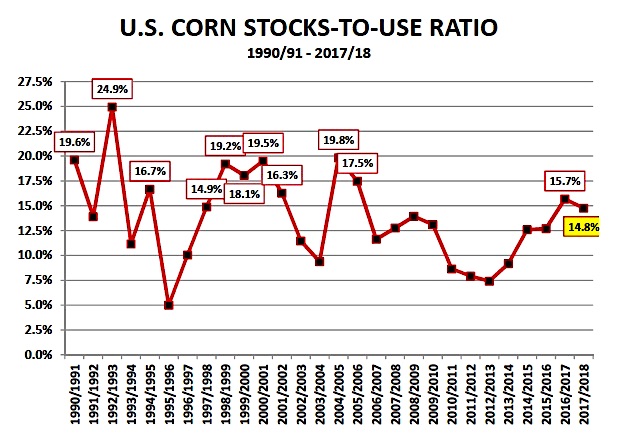
1. From a U.S. corn S&D perspective, despite 2017/18 U.S. corn ending stocks currently projected to exceed 2.0 billion bushels for just the 4th time since 1990/91, the 2017/18 U.S. corn stocks-to-ratio at 14.8% is actually only 1% higher than the average ratio from 1990/91 through 2017/18. Point being, the new-crop carryout estimate at face value feels historically burdensome; however the reality is U.S. corn demand is 6.5 billion bushels HIGHER than it was in 1990/91. Therefore today’s 2.110 billion bushel carryout isn’t as Bearish as it was for example in 1992/93 when U.S. corn ending stocks were nearly equal at 2.113 billion bushels. The stocks-to-use ratio in 1992/93 was 24.9%, more than 10% higher than 2017/18 even though the stocks figures were virtually identical. That said Corn Bulls are attempting to shift the focus away from the perceived price implications of a second consecutive 2.0 billion bushel carryout, and instead have traders focus on near record U.S. corn demand and a tightening stocks-to-use ratio.
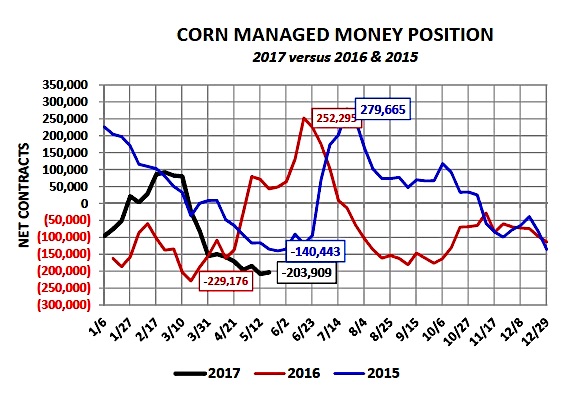
2. The second reason is the current Managed Money short in corn remains in striking distance of the record short of -229,176 contracts from 3/8/2016. Friday’s Commitment of Traders report showed the Managed Money short at -203,909 contracts as of the market close on 5/16. Historically speaking over the last 5-years that position has typically shifted to the long side by at least +100,000 contracts net during May/Jun/Jul. Last year for example, despite a similar U.S. corn S&D setup the Managed Money position on 5/31/16 was +208,696 contracts. In 2015 the Managed Money long peaked at +279,665 contracts on 7/21/15. Therefore I still believe traders are wary of carrying a large net short position into the early summer when one weekend weather forecast can change the narrative in corn literally overnight.
Thanks for reading.
Twitter: @MarcusLudtke
Author hedges corn futures and may have a position at the time of publication. Any opinions expressed herein are solely those of the author, and do not in any way represent the views or opinions of any other person or entity.
Data References:
- USDA United States Department of Ag
- EIA Energy Information Association
- NASS National Agricultural Statistics Service


