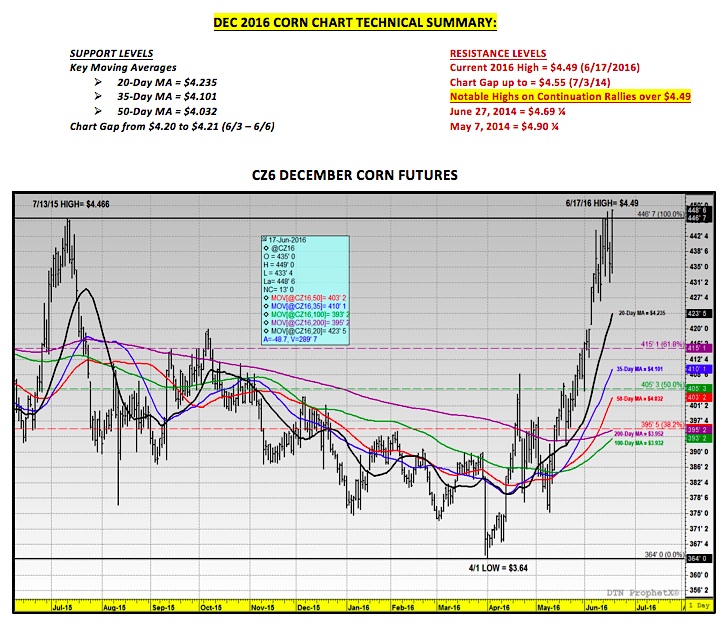
As of Friday’s close (6/17), December corn futures traded up 18-cents per bushel week-on-week, closing at a new 2016 calendar year high of $4.48 ¾. We’ll take a look at a chart of corn futures and evaluate the technicals, but first let’s look at the June 2016 WASDE Report. Getting a complete picture of corn supply and demand can be difficult. We’ll dig into corn exports, production, and, of course, weather.
Here are some key takeaways:
U.S. Corn Supply & Demand Summary –
The USDA lowered the 2015/16 U.S. corn carryout (old-crop) to 1,708 million bushels versus the average trade guess of 1,772 million and 1,803 million in May. The stocks decrease was entirely attributed to a 100 million bushel increase to corn exports with the USDA revising its 2015/16 U.S. corn exports forecast to 1,825 million bushels versus 1,864 million in 2014/15. The export increase was largely anticipated following a recent surge in U.S. corn weekly export sales. In fact, as of the week ending 6/9/2016, year-to-date U.S. corn exports sales had improved to 1,793.0 million bushels versus 1,755.2 million the previous year. The key going forward however will be assessing whether or not those sales actually materialize into physical corn shipments.
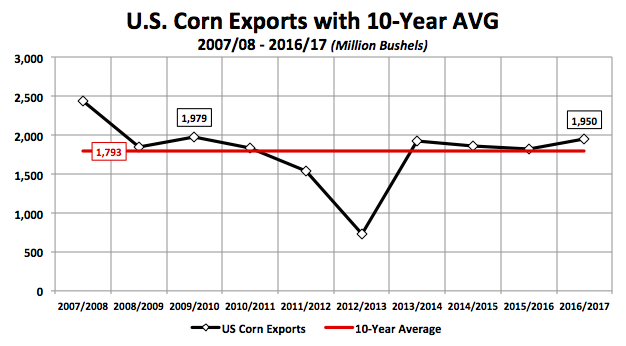
On Monday (6/13), in the USDA’s Weekly Export Inspections report, year-to-date U.S. corn shipments were reported at 1,227.5 million bushels versus 1,329.5 million in 2014/15 as of the week ending 6/9/2016. Therefore while 2015/16 U.S. corn export sales now exceed a year ago, the amount of corn shipped trails 2014/15 by 102 million bushels. Can current U.S. corn exports sales be canceled at a later date, prior to shipment? Absolutely…sales cancelations are not all that uncommon and would be even more feasible for the 2015/16-marketing year given the uncertainty regarding the size and availability of Brazil’s safrinha corn crop for export (Brazil is the world’s 2nd largest corn exporter). Remembering again, approximately 65% of Brazil’s total corn production forecast is now comprised of its 2nd or safrinha corn harvest. That said with drought conditions trimming 2015/16 Brazilian safrinha corn production prospects, the U.S. market has invariably served as a hedge for world importers over the last 6 weeks. In the June Crop report however, Brazil’s 2015/16 corn production forecast was lowered to 77.5 MMT (down 3.5 MMT versus May), which now brings the USDA’s estimate more in-line with current private production projections. I remain of the opinion that once the market feels more confident that production losses in Brazil have been fully digested (or quantified) and are not in danger of moving substantially lower, world importers will once again shift a percentage of their forward corn needs back to Brazil. This could then lead to U.S. corn export sales cancelations, as well as, change the tenor regarding the USDA’s optimism for 2016/17 U.S. corn exports, which were raised to 1,950 million bushels in the June WASDE report. If realized this would be largest U.S. corn exports sales figure since 2009/10’s 1,979 million bushels while exceeding the 10-year average by 157 million bushels.
As far as the 2016/17 US corn balance sheet was concerned, the USDA lowered ending stocks to 2,008 million bushels versus the average trade guess of 2,125 million and the May estimate of 2,153 million. Once again the carryout decline was a function of lower carryin stocks combined with the increased corn exports projection, up 50 million bushels month-on-month. That said a number of traders are already looking ahead to the July 2016 WASDE report and drawing the following price supportive conclusions for 2016/17:
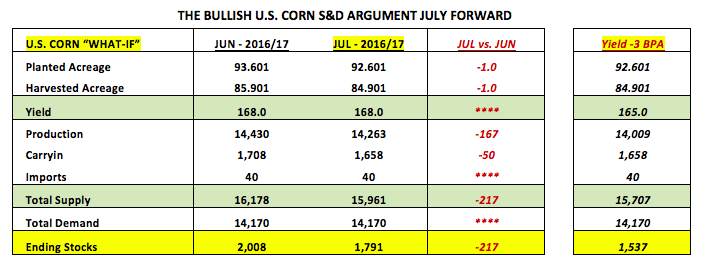
- Projecting another cut to carryin stocks of up to 50 million bushels (1,658 million versus 1,708 million in June)
- Projecting a planted acreage decline of 1 to 1.2 million acres via the June 30th Acreage report
- Projecting a total corn supply decrease of approximately 217 million bushels
- Projecting ending stocks to fall under 1,800 million bushels
- Projecting eventual yield reductions of up to 3 BPA (in August or September WASDE reports), which would lower ending stocks an additional 254 million bushels to 1,537 million
- HOWEVER Projecting NO DOWNWARD adjustments to total corn demand
Here’s the fatal flaw to that assessment in my opinion: U.S. corn demand is just as pliable as U.S. corn supply. It is not stationary.
Recent history has shown that if the USDA chooses to make a material reduction to the U.S. corn yield, that production deficit will likely be partially offset by a decrease to total U.S. corn demand as it relates to the net impact on ending stocks. Here’s a look at the past 10-years showing the U.S. corn demand adjustment from the June forecast versus marketing-year Final assessment along with the corresponding yield adjustment from June versus Final by crop year.
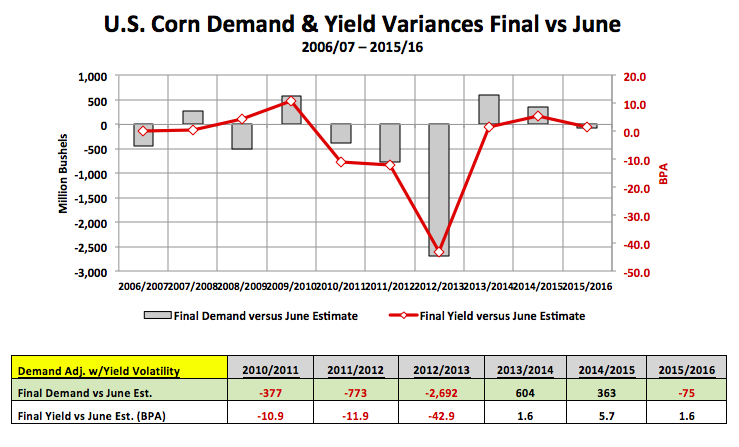
What’s easily apparent is that in the years where the U.S. corn yield trended substantially lower after the June WASDE report (i.e. crop years 2010/11, 2011/12 and 2012/13), total U.S. corn demand also declined aggressively, effectively massaging the real impact on U.S. corn ending stocks. Therefore I think there’s ample evidence to suggest that if indeed the U.S. corn yield does eventually drift lower this summer and fall due to less than ideal growing conditions, the USDA can and likely will lower total U.S. corn demand to mitigate the potentially bullish stocks response. What would be the most likely demand sector to be cut? Feed and residual use, which was estimated at 5,550 million bushels in both the May and June WASDE reports, up 300 million bushels year-on-year and 661 million bushels above the 5-year average. In my opinion that usage increase lacked any reasonably justification at the time it was offered and remains largely unsubstantiated.
CZ6 Price Forecast: December 2016 corn futures traded up to a new 2016 calendar year day high on Wednesday (6/15) of $4.48 ½, which also exceeded the 2015 day high of $4.46 ¾ from July 13th, 2015. The market eventually closed lower however on Wednesday and set back again on Thursday aided in part by a sizable downward correction in soybeans. Friday the market again reversed course adding back in a healthy weekend weather premium based on the unknown of next Monday’s 6 to 10-day weather forecast. Friday CZ6 finished the session by taking out Wednesday’s day high, pushing up to $4.49 and closing at $4.48 ¾.
I mentioned in my column two weeks ago that I believed this rally in corn was primarily built on paper (managed money buying betting on a strengthening La Niña) versus a sound fundamental bias. I still feel that way. However the weather forecast will now take center stage with July quickly approaching (and with it corn pollination). Traders will attempt to either add or subtract bushels from the USDA’s June “trend-line” yield assumption of 168.0 bpa. As it stands today this is what we know:
- Monday’s Crop Progress report showed the U.S. corn rating at 75% good-to-excellent, unchanged week-on-week, which compares to 73% a year ago and 76% as of June 15th, 2014.
- In 4 out of the past 6 years, the USDA’s first yield adjustment (either up or down) was delayed until the August Crop report, which includes 2014/15 and 2015/16.
- The USDA’s latest Drought Monitor shows “abnormally dry” conditions for large sections of Missouri and Indiana.
- NOAA’s latest 6 to 10-day forecast shows a cooler and wetter weather pattern prevailing over the bulk of the Midwest and specifically the Eastern Corn Belt.
That said the narrative in corn shifted more and more Bullish on Friday in a number of notable market wires with Money Managers clearly looking to add long position exposures. The path of least resistance feels higher, however as with any weather dominated market that opinion could shift aggressively based on the next updated forecast. For the moment, emotion and market “spin” are trumping any rational fundamental point of view. Therefore my trading objective is to try and stay with the market to the upside without creating a long position whipsaw should the weather gods deem the coast is clear on Monday morning.
Thanks for reading.
Twitter: @MarcusLudtke
Author hedges corn futures and may have a position at the time of publication. Any opinions expressed herein are solely those of the author, and do not in any way represent the views or opinions of any other person or entity.
Data References:
- USDA United States Department of Ag
- EIA Energy Information Association
- NASS National Agricultural Statistics Service


 Testing Important Price Support")


