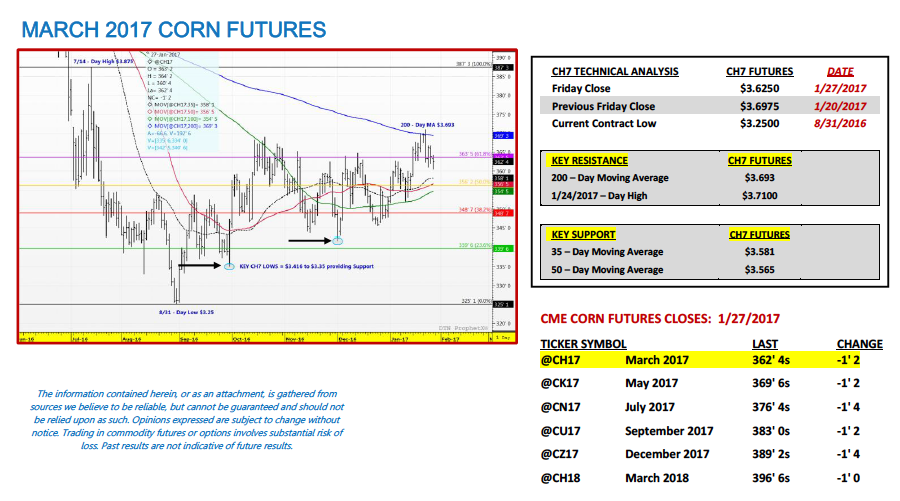
March corn futures moved lower this week, closing down 7 ¼-cents per bushel week-on-week, finishing on Friday (1/27) at $3.62 ½. CH7 showed an inability to close above key price resistance at the 200-day moving average of $3.693, despite trading above that level Tuesday, and faded as a result Wednesday through Friday.
Weekly Highlights:
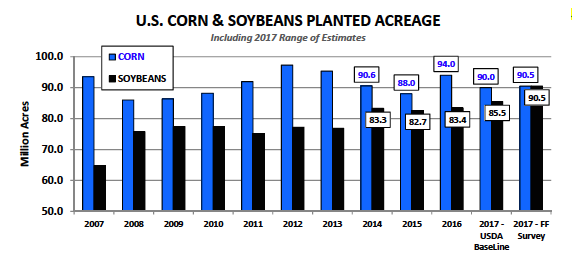
Additional 2017 U.S. Corn and Soybean Planted Acreage Forecasts: There were two notable planted acreage estimates released in the past 10-days for both 2017 U.S. corn and soybeans. A Farm Futures’ survey estimated 2017 U.S. corn planted acreage at 90.49 million acres with soybean acreage forecasted at 90.52 million acres. Informa Economics followed with its revised planted acreage estimates of 90.5 million corn acres and 88.6 million soybean acres. These forecasts compare to the USDA’s Baseline 2017 acreage projections of 90 million corn acres and 85.5 million soybean acres released this past November 2016.
IMPLICATIONS: Clearly the private soybean acreage estimates stand out the most given the USDA’s Baseline estimate is 3 to 5 million acres BELOW both Informa and the Farm Futures’ survey projections. It’s worth noting that the production differential on that many additional soybean acres after applying a trend-line yield estimate of 47.9 bushels per acre (which is the USDA’s Baseline forecast for 2017/18) equals 150 to 240 million bushels of surplus soybeans production. Considering U.S. soybean carryin stocks for 2017/18 are already expected to be the highest they have been since 2007/08 at 420 million bushels, those excess bushels would likely flow back to ending stocks. The USDA’s 2017/18 Baseline S&D forecast for U.S. soybean ending stocks currently stands at 335 million bushels. HOWEVER if we add the bushels attributed to the additional soybean acres, that ending stocks forecast jumps to a low-to-high range of 485 to 575 million bushels. U.S. soybean ending stocks have only exceeded 500 million bushels once since 1986. That said this is something both traders and producers need to consider with November 2017 soybean futures trading above $10.20 per bushel versus just $8.80 to $8.90 per bushel a year ago during this same timeframe…
Brazil Safrinha Corn Planting Underway
There were reports this week that farmers in central Mato Grosso, Brazil had begun planting their safrinha corn. However at this time safrinha corn planting is still in its initial stages (less than 10% planted) with Brazilian farmers very much in the midst of harvesting their 2016/17 soybean crop. It’s worth noting that Brazil’s 2016/17 soybean crop is expected to be record large at 104 MMT (eclipsing the previous record high of 97.2 MMT from 2014/15).
Key Reminders for Traders regarding Safrinha Corn Production:
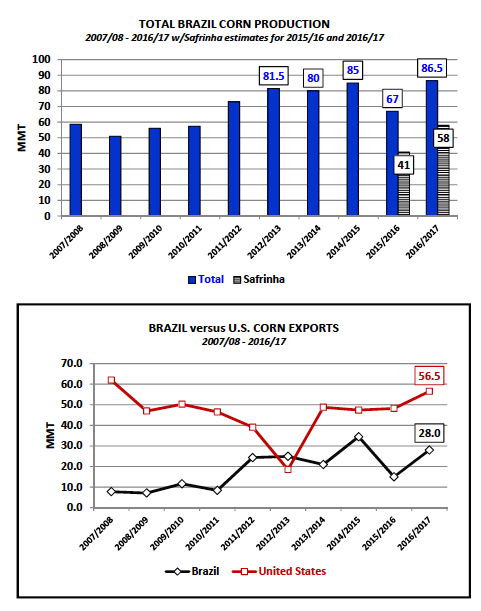
Safrinha corn is planted AFTER the soybean harvest in central Brazil (Jan-Mar). Additionally, safrinha corn production now accounts for approximately 65% of Brazil’s total crop-year corn production. Therefore as it relates to Brazil’s current 2016/17 total corn production forecast, which was estimated at 86.5 MMT in the USDA’s January WASDE report, approximately 56 to 58 MMT of that figure is expected to be safrinha corn. Why is that important? It’s important for 2 main reasons:
- Current CME corn futures prices are reflecting the aforementioned 2016/17 Brazilian corn production forecast of 86.5 MMT, as well as, exports of 28 MMT versus production of just 67.0 MMT and exports of 15 MMT in 2015/16. However two-thirds of that production estimate is predicated on a crop that is just starting to be planted, which means it’s still susceptible to an entire growing season of yet unknown weather events. Point being, there are a number of production uncertainties ahead for Brazil’s safrinha corn crop all of which could have a ripple effect on the U.S. corn market considering Brazil is now the 2nd largest corn exporter in the world.
- Traditionally Brazilian farmers have looked to economize their input costs on their safrinha corn production (especially when forward domestic corn prices don’t justify the additional input investment, which is the present-case situation). The result has often been more production volatility when weather conditions aren’t ideal. This certainly came into play in 2015/16 when safrinha corn production fell to as low as 40 to 41 MMT. That said…there remain a number of moving parts going forward regarding just how big Brazil’s 2016/17 safrinha corn production will be.
What does this mean for current CME corn futures prices? At the moment…not much; however if the weather becomes an issue, specifically in Mato Grosso (which is the largest producing state of safrinha corn in Brazil), it should start to translate into more fundamental price support for corn futures going into the U.S. spring planting season, potentially leading to increased U.S. corn export business late in the 2016/17-marketing year.
KEY PRICING CONSIDERATIONS FOR MARCH CORN FUTURES (CH7) FOR THE WEEK ENDING 1/27/2017: March corn futures (CH7) closed on Friday (1/27) at $3.62 ½ finishing down 7 ¼-cents per bushel week-on-week.
Key takeaways from this week’s price action:
- Technically March 2017 corn futures continued to find resistance at the upper end of the current trading range (approximately $3.70 CH7). The 200-day moving average held at $3.693 on a closing basis, which as I mentioned going home on Friday, 1/20…that would be the test for Corn Bulls this week regarding determining whether or not corn futures were actually serious about breaking-out to the upside. The answer thus far has been unequivocally “NO”…corn futures remain more “pretender” versus “contender” as far as Ag commodities poised for a meaningful rally are concerned. That said March corn futures have essentially been quarantined in a trading range from $3.35 to $3.70 since September 2016.
- The other price driver this week (that I would consider more of an outlier at the moment; however it could have major implications long-term) is the evolving and unpredictable trade relationships the U.S. is now entering into with Mexico and China with President Trump at the helm. Mexico has traditionally accounted for approximately 22 to 24% of total crop-year U.S. corn export business according to the U.S. Grains Council. Meanwhile China consistently buys approximately 1.0 billion bushels of U.S. soybeans annually. Therefore both are two extremely vital/indispensable export destinations for U.S. corn and soybeans. Of the two, which one would I say holds more uncertainty? I would lean towards China for the sole reason that Brazil has the singular ability to displace a large percentage of U.S soybean export business with its sheer crop size of 104 MMT. Argentina could also play a role in additional soybeans export displacement. Conversely when it comes to Mexico’s imports of U.S. corn, I’m not sure they have a reasonable origination alternative.
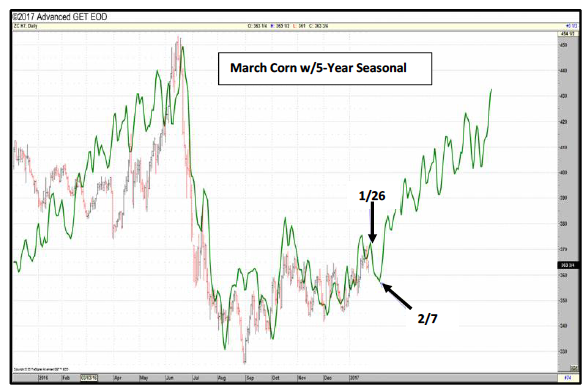
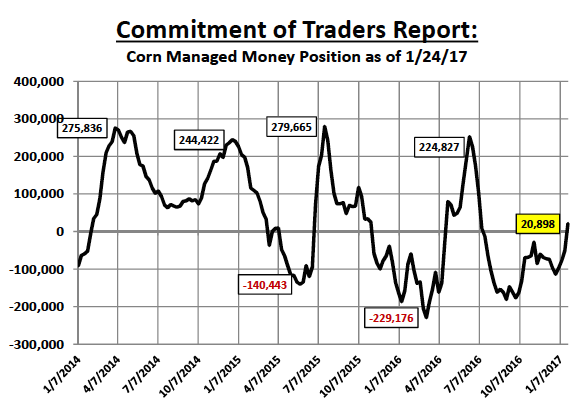
Overall, note the 5-year seasonal price action for March corn futures below. It’s not uncommon for corn futures to lag into the first 7-days of February before returning to a more price positive forward view. It’s also worth noting that Friday’s Commitment of Traders report showed the Managed Money position in corn pushing net LONG to 20,898 contracts (as of the market close on 1/24). This is the first net long money managers have carried in corn since 7/12/16 (8,702 contracts). Corn Bulls…more patience is required.
Thanks for reading.
Twitter: @MarcusLudtke
Author hedges corn futures and may have a position at the time of publication. Any opinions expressed herein are solely those of the author, and do not in any way represent the views or opinions of any other person or entity.
Data References:
- USDA United States Department of Ag
- EIA Energy Information Association
- NASS National Agricultural Statistics Service


