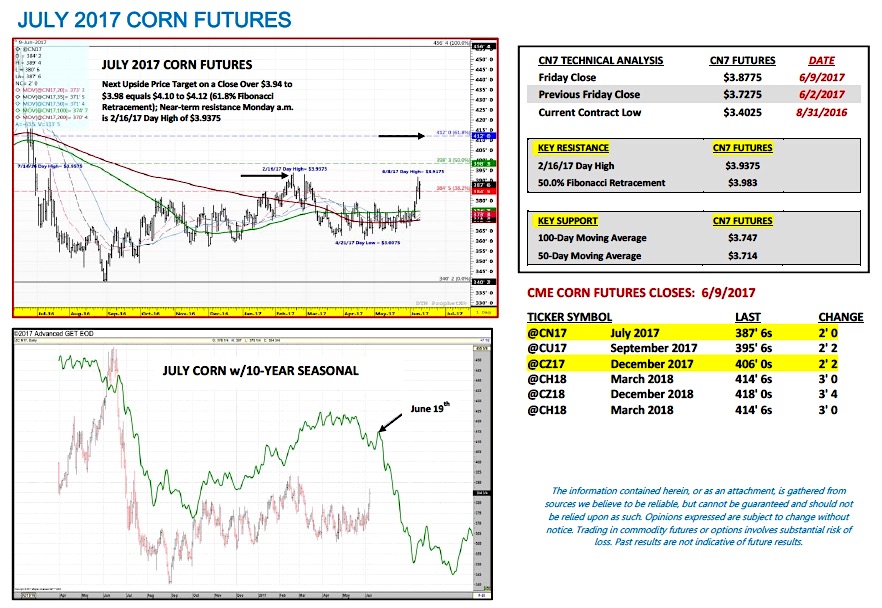
July corn futures moved sharply higher this week, closing up 15-cents per bushel week-on-week, finishing on Friday (6/9) at $3.87 ¾.
December corn futures made a new 2017 day high on Thursday, June 8th of $4.09, eclipsing the previous high-water mark of $4.04 from February 28th.
Weekly Corn Price Drivers (6/5/17 – 6/9/17)
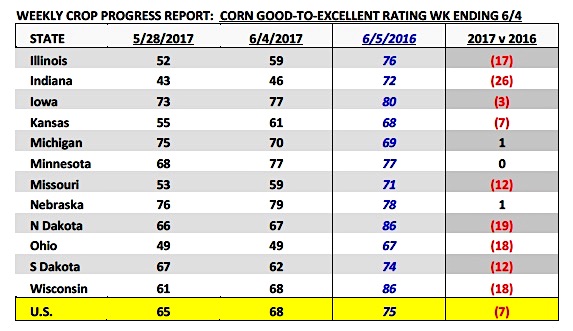
- U.S. Corn Crop Ratings: Monday’s Crop Progress report showed the U.S. corn good-to-excellent rating improving 3% week-on-week to 68% as of the week ending June 4th versus 75% in 2016. Minnesota’s corn crop in particular enjoyed a 9% weekly improvement in its good-to-excellent rating increasing to 77%, which was equal to its rating a year ago. That said a number of key corn producing states still reflected good-to-excellent ratings well below 2016 including Illinois (-17% versus last year), Indiana (-26% versus last year), Missouri (-12% versus last year), Ohio (-18% versus last year), South Dakota (-12% versus last year), North Dakota (-19% versus last year), and Wisconsin (-18% versus last year). All 7 of those states were top 10 corn producers nationwide in 2016 accounting for 41% of total U.S. corn production or 6.21 billion bushels. Therefore in my opinion it will be very hard for the U.S. to achieve a national corn yield above 170 bushels per acre in 2017 without a significant improvement in corn ratings in at least a few of those states, primarily Illinois and Indiana.
Right now the only states keeping a lid on futures prices reacting even more positively to current corn condition ratings are Minnesota, Iowa, and Nebraska, all of which are rated no less than 77% good-to-excellent. Those 3 states long with Illinois are by far the largest corn producing states in the country. Therefore if ratings start to slide in one or more of those 3 states in addition to the weakness in ratings currently being experienced in the 7 states already mentioned above, traders will likely start to consider a U.S. corn yield in the 164 to 168 bpa ranges for 2017. This is the narrative Corn Bulls need to take hold if the June rally producers enjoyed in 2015 and 2016 is to be replicated in 2017.
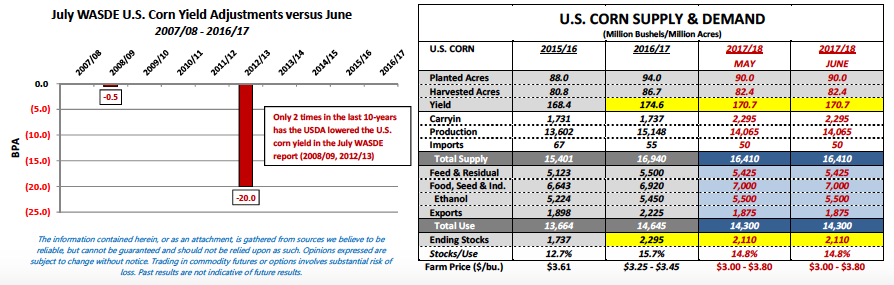
- June 9th WASDE Report Highlights: There were very few if any market making headlines in the USDA’s June 9th WASDE report. The USDA left the 2017/18 U.S. corn Supply & Demand completely unchanged versus a month ago, which then included no adjustments to planted acreage (90 million), yield (170.7 bpa), and ending stocks (2,110 million bushels). In soybeans the USDA increased 2017/18 U.S. beginning stocks 15 million bushels to 450 million. This resulted in 2017/18 U.S. soybean ending stocks increasing to 495 million bushels versus the average trade guess of 485 million. As far as the World S&D figures were concerned, 2017/18 World corn ending stocks dipped slightly versus a month ago to 194.33 MMT (-0.94 MMT vs. May). 2017/18 World soybean ending stocks jumped 3.4 MMT month-on-month to 92.22 MMT, due largely to an increase to beginning stocks. This was attributed to Brazil’s 2016/17 soybean production forecast being raised to 114 MMT versus 111.6 MMT in May. Overall, corn and soybean futures markets reacted fairly disinterested to the USDA’s June S&D revisions.
July Corn Futures Pricing Considerations For This Week
Key takeaways from this week’s price action:
- Weather will now clearly be the dominant market feature going forward. Case in point this week just the suggestion of continued hot and dry temperatures, coupled with stories of “leaf rolling” occurring in corn in the Eastern Corn Belt, was enough to elicit the largest sustained rally in corn futures since the last week in February. This rally resulted in December corn futures trading up to a new 2017 day high of $4.09 on June 8th. The market impact of “weather uncertainly” was also directly reflected in corn options with volatility increasing 4 to 5%, which in effect raised at-the-money option premiums.
- Should this price move be viewed as the start of a bigger rally yet to come or rather a pricing opportunity for both old and new-crop corn? This clearly is the ultimate question. From purely a price seasonality standpoint both the 5 and 10-year July corn seasonals show corn futures rolling over and turning lower on or near June 19th (see page 5). This also coincides with the 2016 “summer” day high in July corn futures, which was achieved on June 8th and then challenged again on June 17th before closing down 16 ½-cents the following trading session on June 20th (see page 4). Therefore “the seasonal” says selling into this rally is the high percentage play. The reality is most years corn rallies beyond the month of June prove unsustainable, the biggest reason being the fear of a drought during the critical corn pollination phase has been quantified and most often eliminated in extended forecast models looking ahead into mid-July. Furthermore when the market turns lower in such instances, the sell-off is typically aggressive and unforgiving. Once again 2016 was the perfect example. July corn futures traded from a day high of $4.38 ¼ on June 17th down to a day low of $3.55 ¾ on June 30th, a price break of 82 ½-cents per bushel in just 9-trading sessions. Not selling into that rally proved costly for specs and producers alike.
- What could make corn prices trade counter-seasonally with spot corn futures moving higher into July and August? 2 things in my opinion…the first being a sizable U.S. corn planted acreage reduction in the USDA’s June 30th Acreage and Stocks report. Right now I’m hearing private analysts predicting a 500,000 to 1.5 million acre decrease versus the USDA’s March 31st Prospective Plantings estimate of 89.996 million acres. The second would be a U.S. corn good-to-excellent rating continuing to stay 7% or greater BELOW 2016. Some traders would likely start to consider a July corn yield reduction. The challenge however for Corn Bulls is that since 2007/08 the USDA has only adjusted the U.S. corn yield from June to July two times (both yield decreases; see chart below), one being the “100-year drought” in 2012/13 and the other a -0.5 bpa yield decrease in 2008/09. Therefore over the last 10-years that’s been a tough sale unless the weather’s turned decidedly “hot and dry” and/or crop conditions have deteriorated substantially. Therefore Jul/Aug rallies are almost entirely predicated on weather/drought and to a lesser degree acreage reductions, which in turn places a greater emphasis on achieving an above-trend yield to offset the lower acreage base (both supply-side market fundamentals).
Thanks for reading.
Twitter: @MarcusLudtke
Author hedges corn futures and may have a position at the time of publication. Any opinions expressed herein are solely those of the author, and do not in any way represent the views or opinions of any other person or entity.
Data References:
- USDA United States Department of Ag
- EIA Energy Information Association
- NASS National Agricultural Statistics Service


 Ready To Break Out?")
