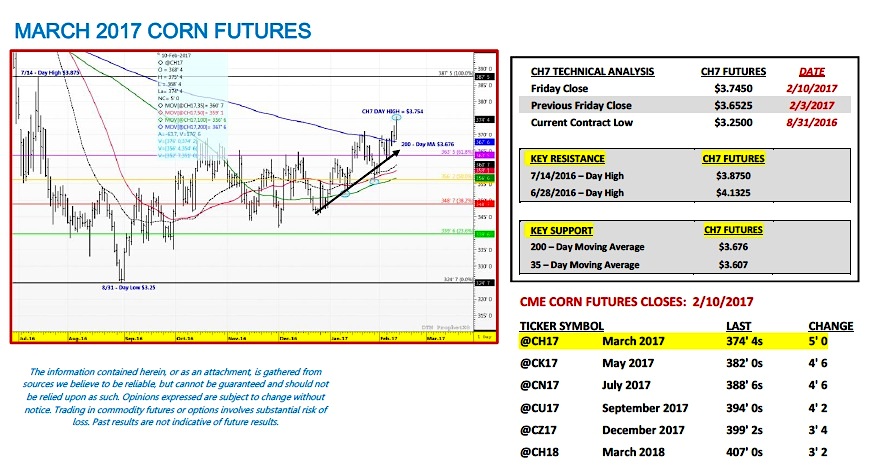
March corn futures moved higher this week, closing up 9 ¼-cents per bushel week-on-week, finishing Friday (2/10) at $3.75 ½. March corn futures (CH7) closed at its highest level since July 13th, 2016.
The big question now: Can the rally continue?
WEEKLY MARKET HIGHLIGHTS
U.S. Ethanol Stocks Continue to Climb: In Wednesday’s Weekly Petroleum Status Report the EIA forecasted U.S. ethanol stocks at 22.085 million barrels for the week ending 2/3/2017, up 215,000 barrels from the previous week. Ethanol stocks remain at their highest level since April 29th, 2016 (22.201 million barrels). The all-time record high in U.S. ethanol stocks is 23.307 million barrels (3/4/2016). That said…despite the continued increase in ethanol inventories, as well as, what accounted to the 2nd fastest weekly ethanol production rate in history of 1.055 million barrels per day, CME ethanol futures managed to close up 10-cents per gallon week-on-week, closing on Friday at $1.59 per gallon versus the March futures contract. This was enough to push the average “Industry” spot ethanol margin back in the black however not by much.
Ethanol plants across the U.S. have continued to experience negative margin pressure from both sustained weakness in ethanol values but also very “cheap” DDGS prices, a direct result of China’s anti-dumping duties on U.S. DDGS imports (DDGS = distillers’ dried grains, the feed co-product from producing ethanol). In January China increased its anti-dumping duties on DDGS imports to a range of 42.4 to 53.7%, up from 33.8% in September 2016. China had been by far the primary buyer for U.S. DDGS exports (accounting for approximately 50% of all U.S. DDGS exports in 2015). Therefore the inability for the U.S. to displace DDGS tons into China’s market is having a substantial impact in pressuring domestic values.
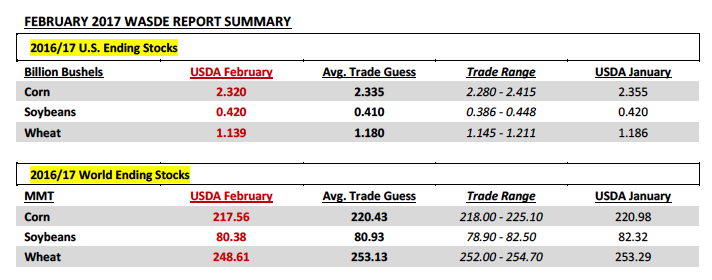
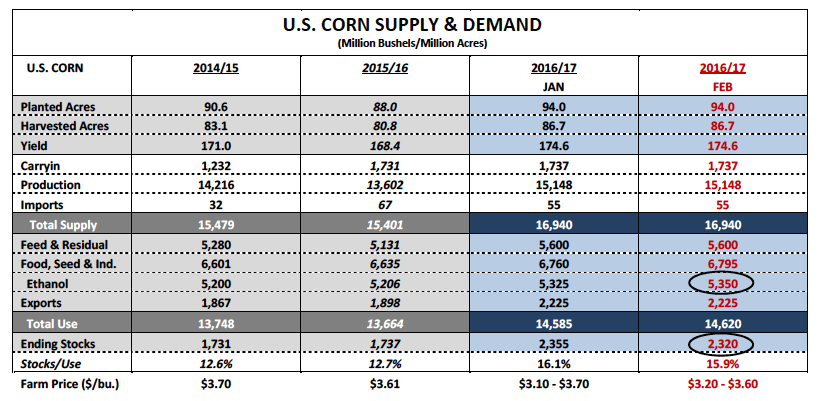
February 2017 WASDE Report Released on Thursday (2/9): There were no huge surprises. The USDA lowered 2016/17 U.S. corn ending stocks to 2,320 million bushels versus the average trade guess of 2,335 million bushels and the January forecast of 2,355 million bushels. The USDA increased corn-ethanol demand 25 million bushels to 5,350 million bushels. U.S. corn exports and feed/residual use were left unchanged at 2,225 million bushels and 5,600 million bushels respectively. The USDA made no changes to the U.S. soybean S&D balance sheet. 2016/17 U.S. soybean ending stocks remained at 420 million bushels versus the average trade guess of 410 million bushels.
U.S. CORN & SOYBEAN DEMAND NOW THE KEY FOCUS: With the USDA finalizing its 2016/17 U.S. corn and soybean production estimates in the January 2017 WASDE report, the focus this month shifted almost entirely to U.S. corn and soybean demand. Soybean Bulls were quick to point out earlier in the week that in last year’s February 2016 WASDE report the USDA forecasted 2015/16 U.S. soybean demand at 3,701 million bushels and U.S. soybean ending stocks at 450 million bushels (stocks-to-use ratio of 12.2%). HOWEVER by the end of the 2015/16 marketing year (August 31st, 2016), total U.S. soybean demand had surged to a record high 3,944 million bushels (+243 million bushels versus the February forecast) with U.S. soybean ending stocks falling to just 197 million bushels (stocks-to-use ratio of 5.0%). In corn the 2015/16 U.S. corn demand adjustment from February 2016 to Final was much more muted, totaling just +119 million bushels resulting in Final U.S corn ending stocks of 1,737 million bushels versus 1,837 million in February. That said the current hope for Corn and Soybean Bulls is that over time the USDA’s latest February 2017 estimates for 2016/17 U.S. corn and soybean demand of 14,620 million bushels and 4,108 million bushels respectively will once again prove too low, resulting in future reductions to ending stocks.
HOWEVER what’s different about the USDA’s current February 2016/17 U.S. corn and soybean demand forecasts versus a year ago? During the 2015/16-crop year the USDA was substantially underestimating both U.S. corn and soybean exports in the February 2016 WASDE report. From February to Final, 2015/16 U.S. soybean exports were raised +246 million bushels (1,690 million in February versus 1,936 million Final). In corn the February to Final increase in 2015/16 U.S. corn exports was +248 million bushels (1,650 million in February versus 1,898 million Final). That said this year the USDA is already forecasting record 2016/17 U.S. soybean exports of 2,050 million bushels, as well as, U.S. corn exports of 2,225 million bushels (highest since 2007/08’s 2,437 million bushels). Point being I’m not sure there’s much room for the USDA to further increase either export figure at this time.
The other problematic World fundamentals for Corn and Soybean Bulls, which again were reinforced in the USDA’s February WASDE report, were the continued expectation of record World corn and soybean ending stocks for 2016/17. World corn stocks were reduced month-on-month 3.42 MMT; however the USDA’s current forecast of 217.56 MMT for 2016/17 would still exceed the previous high-water mark by 7.17 MMT (or 282.3 million bushels).
World soybean stocks also declined month-on-month 1.94 MMT; however once again, the USDA’s current forecast of 80.38 MMT for 2016/17 would still exceed the previous record high by 2.33 MMT (or 85.6 million bushels). More specifically the USDA forecasted Brazil’s 2016/17 soybean crop at a record high of 104 MMT and their corn crop at a record high of 86.5 MMT (both unchanged versus January). Why does Brazil matter? Brazil is the world’s largest world soybean exporter at 59.5 MMT and second largest world corn exporter at 28 MMT. Therefore the World has an ample supply cushion, which includes record production from the U.S.’s primary corn and soybean export competitor.
KEY CH7 PRICING CONSIDERATIONS FOR THE WEEK ENDING 2/10/2017: March corn futures (CH7) closed on Friday (2/10) at $3.75 ½ finishing up 9 ¼-cents per bushel week-on-week.
Key takeaways from this week’s price action:
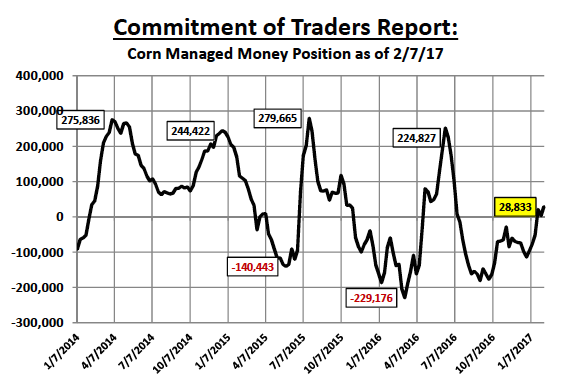
- THE “MONEY” IS BACK BUYING CORN…Friday’s Commitment of Traders report showed Money Managers net buyers of 25,372 corn contracts week-on-week through Tuesday’s close pushing the Managed Money net long to +28,833 contracts. Based on the strength in corn futures Wednesday-Friday I would estimate that position now closer to +35,000 contracts. Compare this to a year ago and Money Managers were carrying a net SHORT of -102,785 contracts. What’s surprising is that from purely a fundamental price perspective, last year’s U.S. corn ending stocks forecast in February was 1,837 million bushels versus the current 2016/17 estimate of 2,320 million bushels. And yet the “money” still seems to want to own corn despite a 483 million bushel crop year-on-year increase in ending stocks.
- Technically March corn futures (CH7) traded up to its highest level since July 15th, 2016 and closed at its highest level since July 13th, 2016. Next week’s price action however will ultimately show whether this rally in corn is for real or simply a market testing the very upper end of its current trading range. The fundamentals in my opinion don’t support another leg higher in corn prices at this time…that said sometimes “money flow” trumps fundamentals.
Thanks for reading.
Twitter: @MarcusLudtke
Author hedges corn futures and may have a position at the time of publication. Any opinions expressed herein are solely those of the author, and do not in any way represent the views or opinions of any other person or entity.
Data References:
- USDA United States Department of Ag
- EIA Energy Information Association
- NASS National Agricultural Statistics Service


