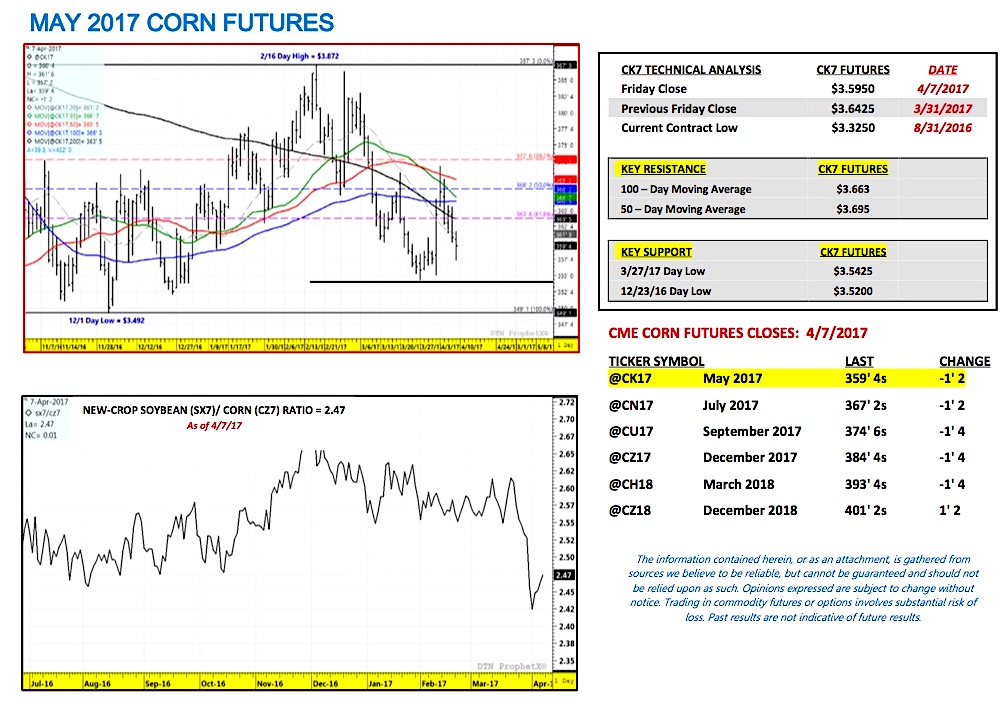
May corn futures moved slightly lower this week, closing down 4 ¾-cents per bushel week-on-week, finishing on Friday (4/7) at $3.59 ½.
Corn futures proved unable to distance themselves from the negative pricing overtones of the March 31st Prospective Plantings and Grain Stocks reports. Soybean futures suffered a similar fate with May soybeans closing down 4-cents per bushel week-on-week, finishing on Friday (4/7) at $9.42.
Aftermath of March Prospective Plantings and March Stocks Reports: The Bearish fundamental reality of the USDA’s 2017 March Prospective Plantings estimates and corresponding ending stocks projections for both 2017/18 U.S. corn and soybeans balance sheets was more than enough to dissuade any significant buying interest this week in either commodity.
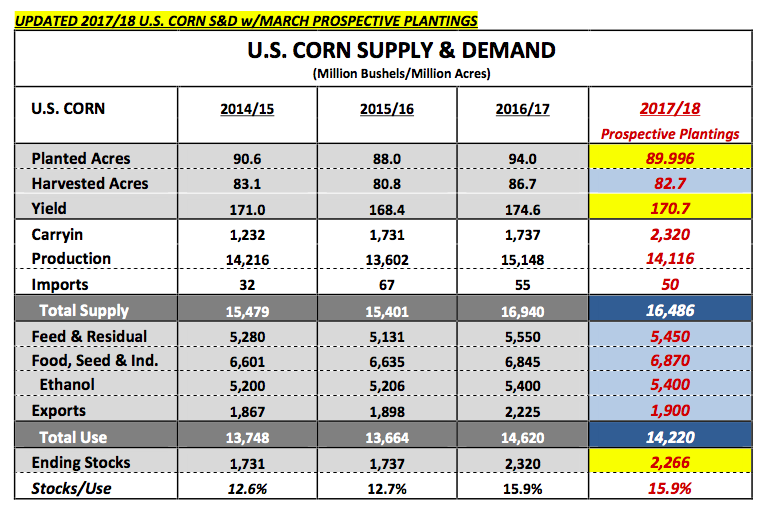
In corn, traders were quick to do the math on the real U.S. S&D impact of a year-on-year 4.01 million planted acreage reduction. Even with only 89.996 million planted acres, after applying carryin stocks of 2.320 billion bushels, a trend-line yield of 170.7 bushels per acre, and total demand of 14.220 billion bushels, 2017/18 U.S. corn ending stocks still penciled back at approximately 2.266 billion bushels. Furthermore given the USDA’s higher than expected March 1 corn stocks estimate of 8.616 billion bushels (+82 million bushels above the average trade guess), a number of private analysts also suggested carryin stocks could eventually push past 2.400 billion bushels.
Therefore what initially appeared as a potentially “Bullish” narrative for corn futures following the USDA’s sharp reduction to planted corn acreage, was over the course of 3 or 4 days largely discredited due to its inability to create a significant theoretical downward trend change in U.S. corn ending stocks for the 2017/18-crop year. That said if over time traders can convince themselves that due to adverse summer growing conditions, the 2017/18 U.S. corn yield could fall to less than 161 bushels per acre (equating to U.S. corn ending stocks below 1.500 billion bushels), June/July corn rallies above $4.50 December corn futures remain a possibility. However over the short-term I believe it’s going to be hard to generate sustainable rallies above key technical resistance until Midwest weather becomes more of a price driver (i.e. the current day high and calendar year high in December 2017 corn futures of $4.04 from 2/28).
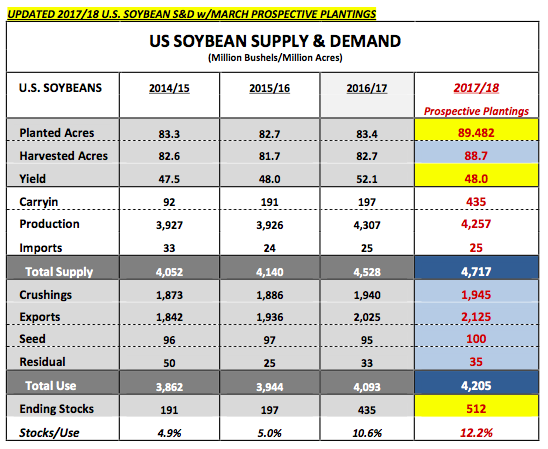
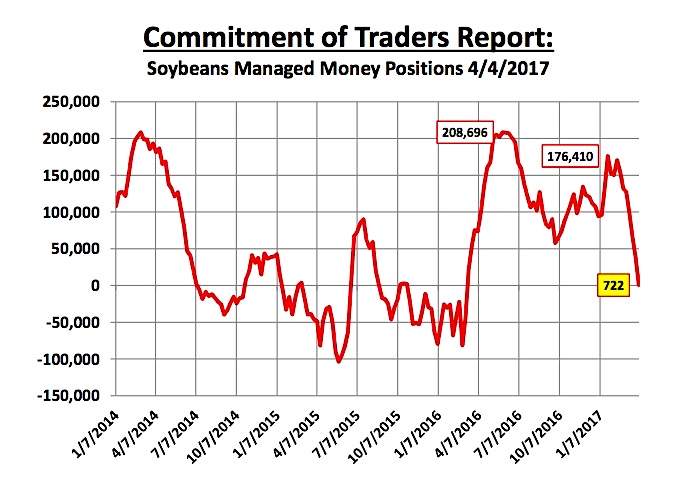
In soybeans, the USDA’s March acreage and stocks figures didn’t provide even the slightest thread of Bullish pricing spin. 2017 prospective soybeans plantings of 89.432 million acres (+6.049 million higher than 2016) combined with carryin stocks of 435 million bushels, a trend-line yield estimate of 48 bushels per acre, and total demand of 4.205 billion bushels implied a 2017/18 U.S. soybeans ending stocks forecast of 512 million bushels (only 2 times since 1980 have U.S. soybeans ending stocks exceeded 500 million bushels). Additionally, just like in corn, March 1 soybean stocks came back higher than expected at 1.735 billion bushels, which was +51 million bushels above the average trade guess. This in turn has led to speculation that soybean carryin stocks will eventually exceed 435 million, which means 2017/18 U.S. soybeans ending stocks closer to 530 million bushels remains a possibility. None of this is Bullish for soybean futures, evidenced by May soybean futures breaking from a day high and calendar year high of $10.88 ¼ per bushel on January 18th to below $9.40 per bushel this past week.
The question now becomes can corn and soybean futures overcome the implied realities of what on paper appear to be extremely burdensome 2017/18 U.S. ending stocks projections and stage legitimate rallies later this spring and summer? I still believe they can; however it’s likely going to necessitate a supply side concern. Unfortunately for Corn and Soybean Bulls this type of rally will take time to evolve. With the U.S. corn yield averaging 171.3 bpa and U.S. soybean yield averaging 49.2 bpa over the last 3-crop years traders have been conditioned to now expect above-trend line yields. The truth is last 3-crop years and the sustained record to near-record yields that have been achieved are virtually unprecedented.
By comparison the 3-year average U.S. corn and soybean yields for 2013, 2011, and 2010 (2012 was excluded due to it representing one of the worst U.S. corn droughts in the past 100 years) were 152.5 bpa and 43.2 bpa respectively. Therefore it wasn’t that long ago that achieving a U.S. corn yield of 160 to 162 bpa and a U.S soybean yield of 44 to 46 bpa was considered “above-trend.” Point being at some point history would suggest the U.S. Midwest is due for a more normalized summer growing season, which on the basis of the past 3-year crop years would argue for yields at or below-trend line for 2017.
KEY CK7 PRICING CONSIDERATIONS FOR THE WEEK ENDING 4/7/2017:
May corn futures (CK7) closed on Friday (4/7) at $3.59 ½ finishing down 4 ¾-cents per bushel week-on-week.
Key takeaways from this week’s price action: Immediate Corn rallies unlikely; however expect corn futures to hold in the mid-$3.50’s.
- Corn futures seem primed for at least another 2 to 3-weeks of largely sideways, choppy price action. Continued strong U.S corn export demand (crop year-to-date U.S corn export sales remain +49% above a year ago) coupled with robust corn-ethanol usage (U.S. ethanol production running +5.1% ahead of a year ago over the 4-week period ending 3/31) should prevent corn futures from breaking much lower over the short-term. That said traders still believe U.S corn export sales will eventually fall-off July forward with private analysts expecting a record large Brazilian corn crop in excess of the USDA’s current March WASDE forecast of 91.5 MMT. Additionally U.S. ethanol stocks moved to a record high 23.705 million barrels for the week ending 3/31/17, which could eventually pressure U.S. ethanol margins and prompt a reduction in ethanol run-rates. Therefore “today’s” supportive corn demand outlook could change quickly in the not too distant future.
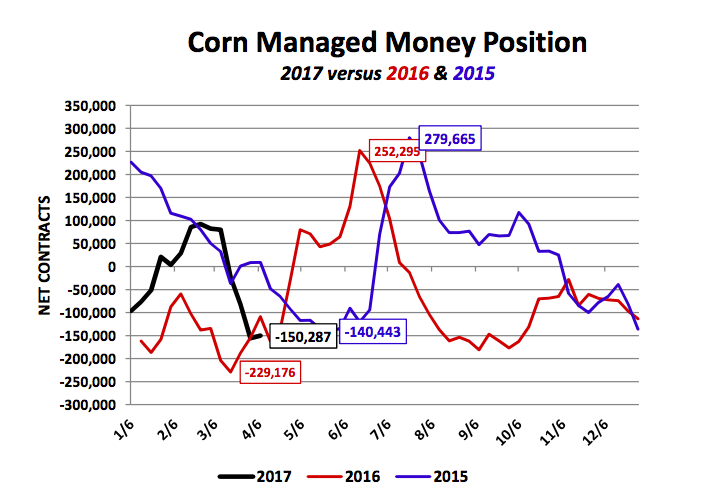
- The other potential offset to continued selling pressure in corn is the current Managed Money net corn short of -150,287 contracts. Given the possibility of “weather” becoming a much more influential price driver with spring planting just ahead in the U.S. Midwest, I’m not expecting money managers to continue aggressively selling corn at this time…regardless of their burdensome forward view on U.S. corn stocks.
Thanks for reading.
Twitter: @MarcusLudtke
Author hedges corn futures and may have a position at the time of publication. Any opinions expressed herein are solely those of the author, and do not in any way represent the views or opinions of any other person or entity.
Data References:
- USDA United States Department of Ag
- EIA Energy Information Association
- NASS National Agricultural Statistics Service

