Corn Market – Weekly Highlights
Below is a list of key happenings in the Corn market and a few concepts that traders should be aware of. Further below is a section focusing on my price outlook for December Corn Futures… and why bulls need to start playing defense.
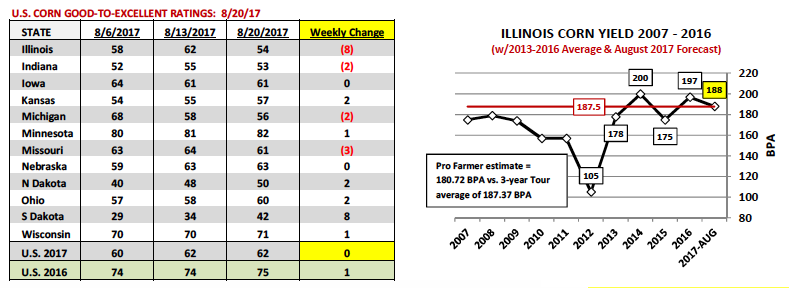
- Monday’s Weekly Crop Progress report showed the U.S. corn good-to-excellent rating unchanged week-on-week at 62% as of 8/20/17 versus 75% a year ago. The one state however that did experience a significant weekly ratings decline was Illinois. Illinois’s good-to-excellent rating fell 8% to 54%, which compares to 84% in 2016 (final yield of 197 BPA), 56% in 2015 (final yield of 175 BPA), 82% in 2014 (final yield of 200 BPA), and 59% in 2013 (final yield of 178 BPA). In the August Production report NASS estimated Illinois’s corn yield at 188 BPA. Given the USDA’s current corn rating for IL, that projection feels high. Also of note, Illinois rainfall has been -0.41” below normal this year with corn growers experiencing 20 fewer growing degree days, all of which should have a negative influence on optimizing corn yields. Nationally as a point of reference, Illinois is the 2nd largest corn producer in the country, trailing only Iowa, with 2017 state corn production estimated at 2,059 million bushels (14.5% of total U.S. 2017/18 corn production).
- Key takeaways from the Farm Journal Pro Midwest Crop Tour 2017: South Dakota was the state I was most interested in given its good-to-excellent rating at one point was reported at just 28% good-to-excellent (7/23/17), just 1% higher than 2012’s drought devastated corn crop that produced a final state corn yield of 101 BPA. Interestingly enough Pro Farmer had a vastly different impression of South Dakota’s corn crop this year relative to its historically low good-to-excellent rating. Based on the yield results from 74 samples, South Dakota’s corn yield averaged 147.97 BPA. This compares to NASS’s August yield forecast of 140 BPA and SD’s 3-year state average of 156 BPA. The conclusion I’ve drawn is that South Dakota’s 2017 corn crop is likely below-trend but not the epic disaster implied by this summer’s crop condition ratings.
- The other state that stood out was Iowa. The tour produced an average corn yield for IA of 179.79 BPA versus 188.17 BPA in 2016, down just 4.5%. In August NASS estimated Iowa’s corn yield at 188 BPA versus 203 BPA in 2016, down 7.4%. Therefore if the tour’s percentage holds (-4.5% year-on-year) that would suggest a final Iowa corn yield of 194 BPA as possible, which seems high once again relative to Iowa’s current good-to-excellent rating of 61%.
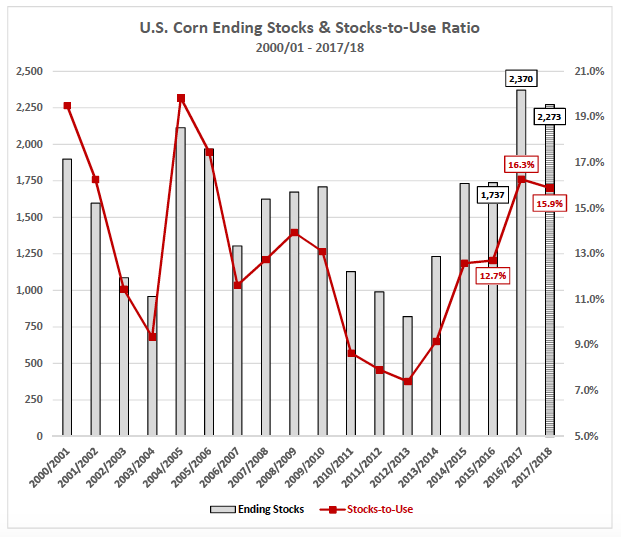
- In the August 2017 WASDE report, the USDA’s 2017/18 U.S. corn carryout was estimated at 2.273 billion bushels, equating to a stocks-to-use ratio of 15.9%. This compares to 2.370 billion bushels and 16.3% in 2016/17, and 1.737 billion bushels and 12.7% in 2015/16. On paper this year’s carryout would be the 2nd highest since 1988; however from a stocks-to-use ratio perspective there have been 5 other crop years since just 2000/01 that have featured higher stocks-to-use ratios.
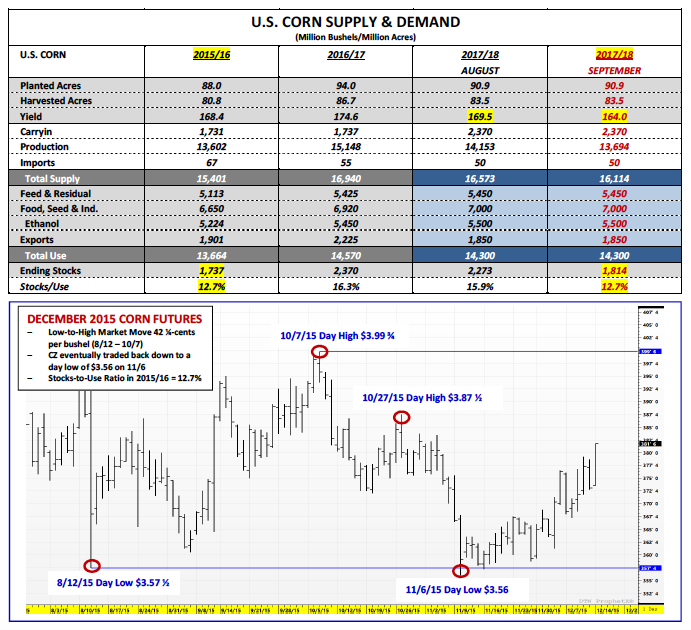
This begs the question, “What type of stocks-to-use ratio would in theory justify a rally back to $4.00 in December 2017 corn futures?” The 2015/16 U.S. corn stocks-to-use ratio of 12.7% ultimately led to a rally back to a day high of $3.99 ¾ on October 7th, 2015. The Aug/Sep low that year was $3.57 ½ on August 12th, 2015. Therefore the low-to-high market move (from August thru October) totaled 42 ¼-cents per bushel. This year it would take NASS revising the 2017/18 U.S. corn yield down to 164 BPA (versus 169.5 BPB in August) in the September Production report to produce a similar 12.7% stocks-to-use ratio. That type of yield would reduce U.S. corn production 459 million bushels month-on-month to 13.694 billion bushels and decrease U.S. corn ending stocks to 1.814 billion bushels (assuming no adjustments to total U.S corn demand). I still believe that type of yield reduction is possible moving forward.
December Corn Futures Short Term Price Outlook:
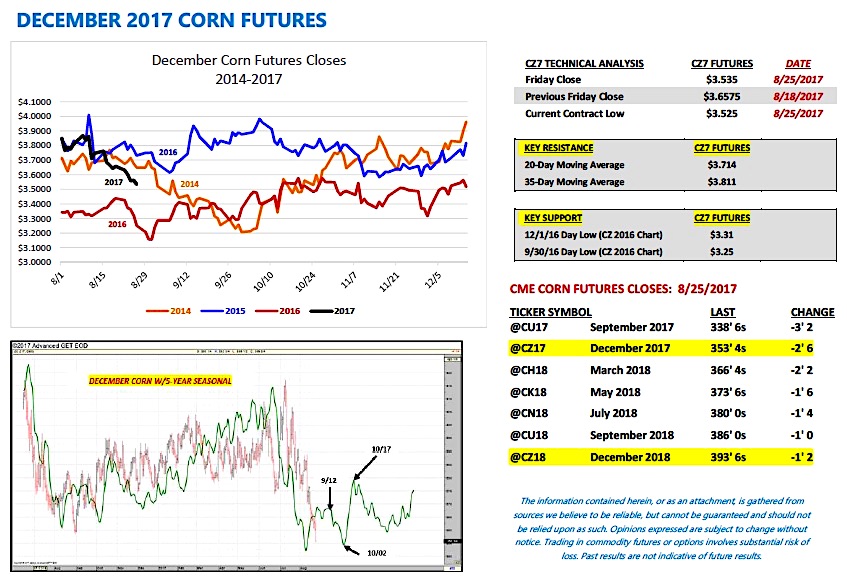
Money managers were sellers of nearly 57,000 corn contracts week-on-week through Tuesday’s close. The Managed Money position in corn was revised to being net short -17,171 contracts. Not surprisingly that selling pressure led to Dec ‘17 corn futures making a new contract low of $3.52 ½ on Friday (8/25). That said will CZ7 keep moving lower? In 2016 the Managed Money position increased to a net short of nearly -180k contracts on 9/29/16, which in turn produced a day low of $3.25 in Dec ’16 corn futures on 9/30/2016.
To avoid a repeat performance of 2016 price action, Corn Bulls need CZ7 to hold $3.50 per bushel early this week. Will it hold that level? That will largely depend on the Managed Money deciding whether or not to add to or hold its current short corn position. If money managers continue selling corn, holding $3.50 CZ7 could prove difficult short-term.
Thanks for reading and good luck out there.
Twitter: @MarcusLudtke
Author hedges corn futures and may have a position at the time of publication. Any opinions expressed herein are solely those of the author, and do not in any way represent the views or opinions of any other person or entity.
Data References:
- USDA United States Department of Ag
- EIA Energy Information Association
- NASS National Agricultural Statistics Service

 Flirting With Critical Support… Again")


