WEEKLY HIGHLIGHTS:
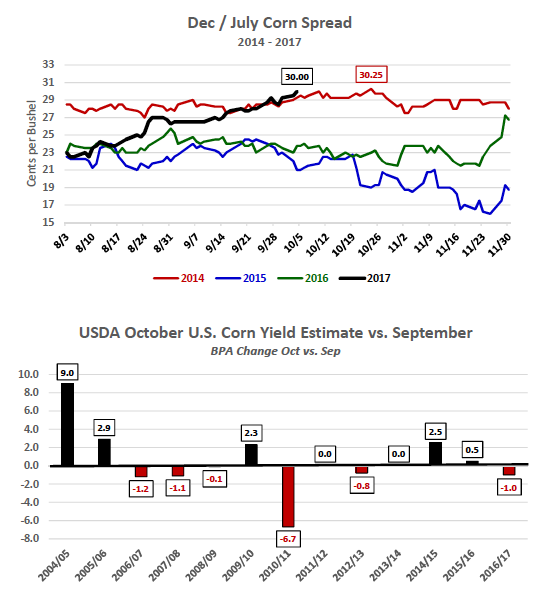
With the October 12 Crop Production report quickly approaching, a number of notable private analysts started offering their October U.S. corn yield estimates this week.
FCStone in particular revised its October U.S. corn yield forecast to 169.2 bushels per acre with total production of 14.129 billion bushels. This compares to the USDA’s September yield estimate of 169.9 BPA and total production of 14.184 billion bushels. I have yet to see a private yield projection that strays by more than 1 to 2 BPA from the USDA’s September figure (up or down). Since 2004 the USDA has lowered the U.S. corn yield in the October WASDE report on 6 different occasions versus 5 increases (in 2011 and 2013 the USDA did not change the yield from September to October). The largest October yield decrease came in 2016, which totaled -6.7 BPA. The other 5 yield declines ranged from -0.1 to -1.2 BPA. Based on the September weather pattern, as well as, early corn yield results in Illinois, Iowa, Indiana, and Missouri, I’m not expecting much if any yield reduction in the October WASDE report.
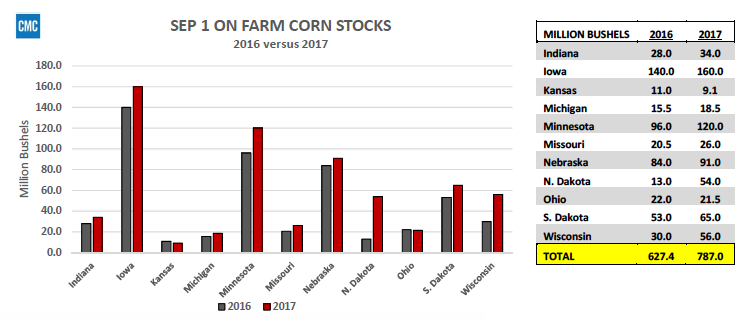
September 1st, 2017 U.S. corn stocks were reported at 2.295 billion bushels versus 1.737 billion bushels a year ago.
The USDA released its September Stocks report on 9/29; however the ramifications of a sizable year-on year stocks increase totaling 558 million bushels seemed to weigh on corn futures prices throughout the week. “On Farm” U.S. corn stocks specifically jumped 25.4% from 2016/17 increasing to 787 million bushels, the largest On Farm stocks figure since 2005/06’s 820.5 million bushels. Considering this year’s U.S. corn harvest is expected to exceed 14.0 billion bushels for only the 3rd time in history, producers will now be forced to start emptying their bins regardless of price to make room for new-crop corn. That said as it relates to the short-term market impact, corn futures are currently having to digest a combination of both old and new-crop corn producer selling.
Weekly U.S. corn export sales totaled 32.0 million bushels for the week ending 9/28/2017. Year-to-date sales increased to 478.9 million bushels versus 811.1 million bushels last year (-41%). The lack of U.S. corn export business has been another huge negative for the corn market. Even with a relatively “cheap” Dollar, U.S. corn exports have struggled to gain traction with competition from Brazil, Argentina, and Ukraine continuing to displace U.S. sales. The USDA continues to forecast a 2017/18 U.S. corn export sales decline of 445 million bushels versus 2016/17 (-19%). For this export gap to narrow world corn buyers will need to fear a legitimate corn production decline in Brazil specifically for 2017/18. That said, even with some ongoing soybean planting delays in Brazil, (which theoretically could delay the timing of Brazil’s winter corn planting window in February; winter corn production accounts for 65% of total Brazilian corn production), those fears have yet to materialize.
DECEMBER CORN FUTURES: Short-Term Price Outlook
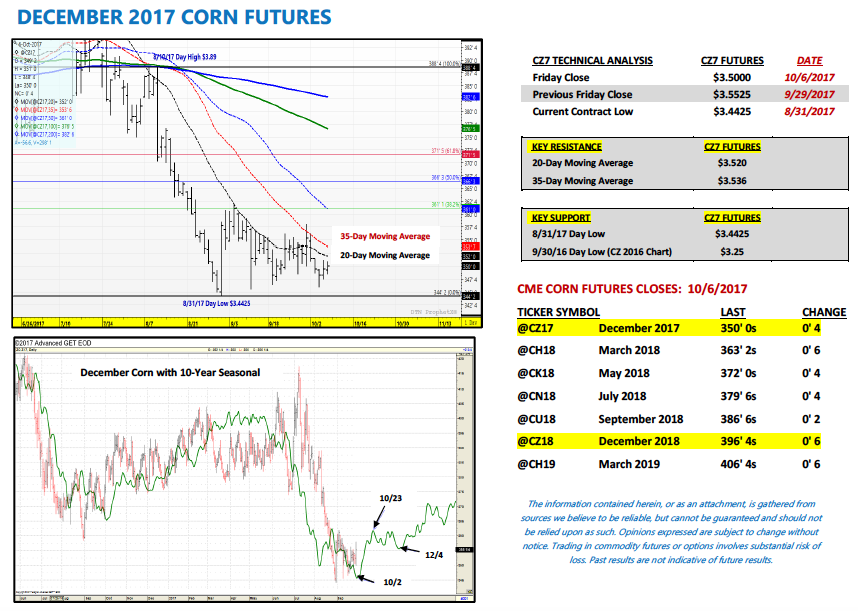
December corn closed lower on the week, finishing down 5 ¼-cents per bushel at $3.50. Friday’s Commitment of Traders report showed the Managed Money net short increasing to -143,201 contracts. Corn is finding consistent selling pressure from both Money Managers and Commercial Hedgers (who are selling futures to offset physical cash corn purchases from producers). In 2016 Money Managers did reduce their net short corn position exposures by over 100,000 contracts during the month of October. Corn Bulls will need to hope that pattern reasserts itself in 2017 to stop the current sideways to lower price momentum in corn futures.
Overall…December corn futures continue to trade in a very narrow range from approximately $3.58 (day high on 9/29) to $3.46 (day low on 10/4). The 20-day and 35-day moving averages of $3.52 and $3.53 ¾ respectively continue to offer nearby topside resistance. If CZ7 can manage a close above the 35-day the next area of major price resistance would be $3.61, which coincides with the 50-day moving average and 38.2% Fibonacci retracement. I don’t foresee a breakout move above $3.60 looming…barring a Bullish yield surprise in the October WASDE report. Furthermore a delayed U.S. corn harvest only works to prolong the selling pressure from commercial hedgers (U.S. corn harvest is 9% behind the 5-year average).
Thanks for reading.
Twitter: @MarcusLudtke
Author hedges corn futures and may have a position at the time of publication. Any opinions expressed herein are solely those of the author, and do not in any way represent the views or opinions of any other person or entity.
Data References:
- USDA United States Department of Ag
- EIA Energy Information Association
- NASS National Agricultural Statistics Service

 Flirting With Critical Support… Again")


