U.S. Corn futures dipped lower early in the week only to recover by week’s end. Corn prices have been stuck in a range between $3.50 and $4.00 for several weeks.
The lower end of that range is getting tested… and if it gives way, the 2016 lows could be tested.
WEEKLY HIGHLIGHTS: 9/11 – 9/15
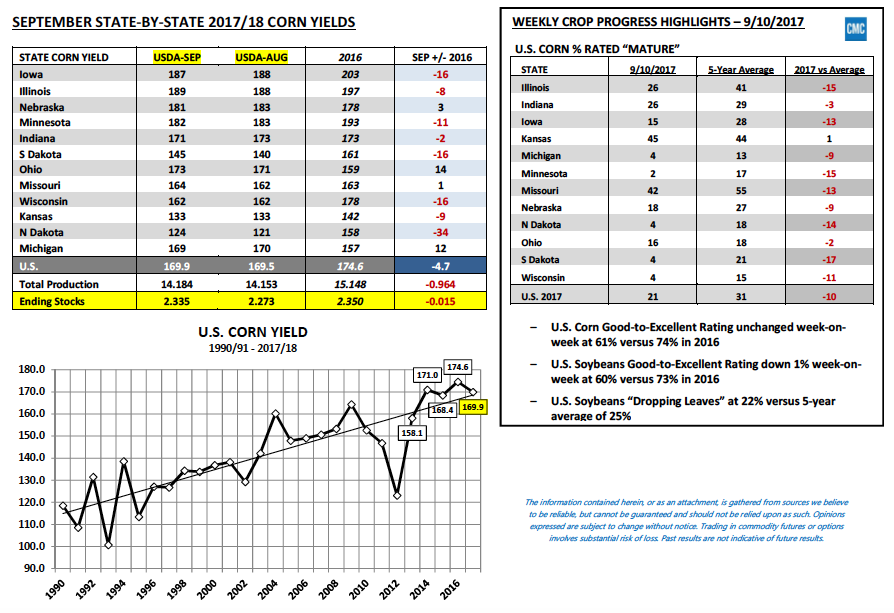
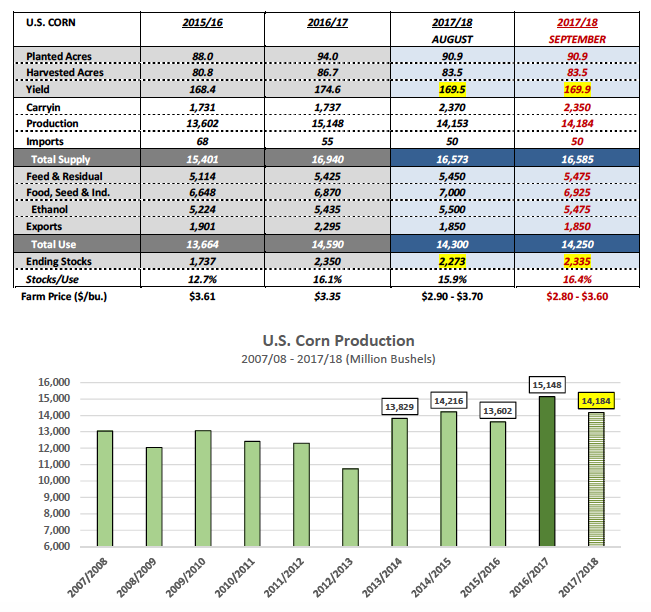
- On Tuesday the USDA released its September 2017 WASDE report, as well as, its updated Crop Production report, both of which contained a host of new Bearish S&D adjustments for U.S. corn and soybeans. In corn the USDA raised its 2017/18 U.S. corn yield estimate to 169.9 BPA versus 169.5 BPA in August and the average trade guess of 167.9 BPA. The yield increase resulted in U.S. corn production improving to 14.184 billion bushels, the 3rd highest total all-time (trailing only 2014/15 and 2016/17). 2017/18 U.S. corn ending stocks were revised upward to 2.335 billion bushels, +120 million bushels ABOVE the average trade guess and +62 million bushels higher than a month ago. This was not what Corn Bulls were hoping for. Immediately after the numbers were released December corn futures sold-off aggressively trading down to a day low of $3.45 ½, coming with 1 ¼-cents of the current contract low of $3.44 ¼ established on August 31st.
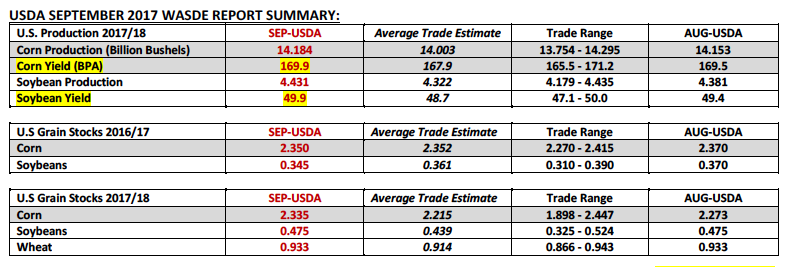
- In soybeans the USDA raised its 2017/18 U.S. soybean yield estimate to 49.9 BPA versus 49.4 BPA in August and the average trade guess of 48.7 BPA. The yield increase resulted in U.S. soybean production improving to a record high 4.431 billion bushels, up 50 million bushels versus a year ago. 2017/18 U.S. soybean ending stocks were unchanged month-on-month at 475 million bushels; however the differential in stocks relative to 2016/17 increased to +130 million bushels.
What’s the likely lasting impact on corn futures following the release of these key September reports?
The reality is for corn futures to sustain rallies Corn Bulls will once again have to try and create a supply-side narrative that suggests NASS is grossly over-estimating U.S. corn yield potential and that a harvest “yield” surprise awaits in October and November.
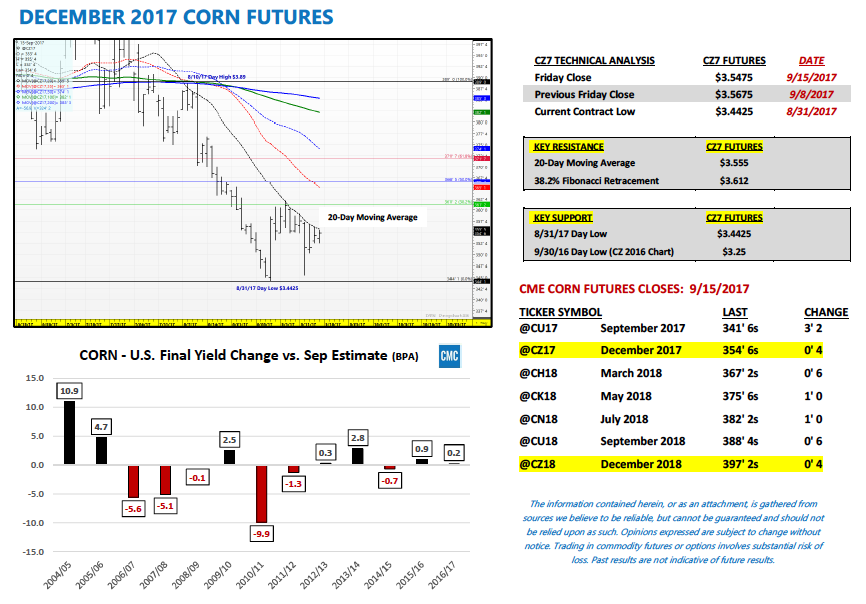
What’s the history of Final U.S. corn yield changes versus the USDA’s September estimate?
Since 2004/05, the Final U.S. corn yield has been higher than the September forecast on 7 occasions and lower on 6 occasions Over that time period the largest Final versus September U.S. corn yield decrease came in 2010/11 totaling -9.9 BPA (Final yield was 152.6 BPA versus 162.5 BPA in September). Furthermore, the average yield decrease during the 6 occasions that featured Final versus September U.S. corn yield declines was -3.8 BPA. Based on what we know today via the Farm Journal Pro Midwest Crop Tour (which estimated the U.S. corn yield at 167.1 BPA), as well as other private forecasts, I’d be very surprised to see more than a 3 to 4 BPA decline in the U.S. corn yield in future USDA Crop reports. This would then suggest that the 2017/18 U.S. corn carryout is unlikely to dip back under 2.0 billion bushels even with minor production decreases moving forward. (4 BPA decrease would result in U.S. corn production dropping 331 million bushels from the USDA’s current forecast reducing U.S. corn ending stocks to 2.003 billion bushels)
US CORN FUTURES SHORT-TERM PRICE OUTLOOK:
Price action this week was indicative of a market that isn’t likely to go much of anywhere over the next several weeks due to both U.S. and World ending stocks remaining at more than adequate levels. Furthermore any lingering doubts concerning the accuracy of the USDA’s August U.S. corn yield estimate being potentially overly optimistic (relative to crop condition ratings) were largely dismissed on Tuesday with the USDA doubling down on their forecast from a month ago in the September WASDE report.
Friday’s Commitment of Traders report showed the Managed Money net short in corn increasing to -119,412 contracts. Last year money managers, who were at the time trading a very similar U.S. corn S&D to 2017/18, expanded their net short corn position to -181,893 contracts during the month of September. In 2016 December corn futures eventually traded down to a day low of $3.25 on 9/30. Will this pattern repeat itself? For now I believe the contract low of $3.44 ¼ in Dec corn holds; however a retest of that level is possible over the next 2 weeks.
Twitter: @MarcusLudtke
Author hedges corn futures and may have a position at the time of publication. Any opinions expressed herein are solely those of the author, and do not in any way represent the views or opinions of any other person or entity.
Data References:
- USDA United States Department of Ag
- EIA Energy Information Association
- NASS National Agricultural Statistics Service


