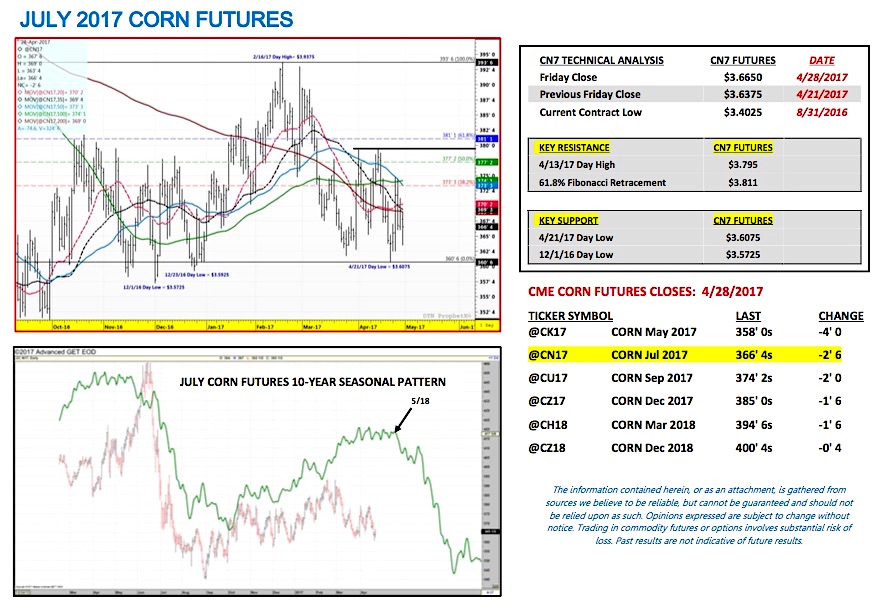
July corn futures moved higher this week, closing up 2 ¾-cents per bushel week-on-week, finishing on Friday (4/28) at $3.66 ½.
Corn futures higher weekly close was due primarily to concerns regarding U.S. corn planting progress.
U.S. CORN PLANTING PROGRESS TAKES CENTER STAGE:
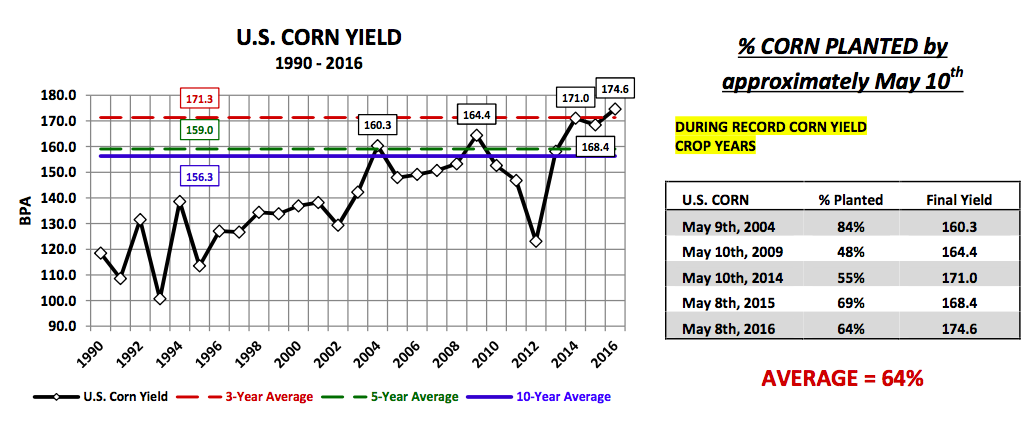
With the first week of May quickly approaching the market’s focus has shifted almost entirely to the U.S. corn planting pace. Historically speaking traders have used the date of May 10th as the preferred benchmark for a minimum of 50% of the U.S. corn crop being planted, which in theory lowers the risk of a majority of the U.S. crop being exposed to late summer heat during the key pollination phase. Typically (not always) the earlier corn gets planted in the spring, the better the yield performance due to corn pollinating prior to the warmest summer days and nighttime temperatures in late July and early August.
Over the last 3-crop years 2014/15, 2015/16, and 2016/17, on average 63% of the U.S. corn crop has been seeded on or slightly before May 10th. The 3 final U.S. corn yields over that same period of time have been 171.0 bpa, 168.4 bpa, and 174.6 bpa, all of which represented record to near record U.S. corn yields. Furthermore if I include the other two instances the national corn yield has exceeded 160 bpa (2004/05’s 160.3 bpa and 2009/10’s 164.4 bpa) that average planting percentage actually inches up to 64%. Therefore there is a fairly strong historical correlation between getting approximately 60% of the U.S. corn crop planted by May 10th and yield potential being optimized.
Have there been occasions where an accelerated early planting pace didn’t produce an above-trend final U.S. corn yield? Absolutely…during the 2012/13-crop year an incredible 85% of the U.S. corn crop was planted by May 12th following an abnormally warm and dry spring in the Midwest. The problem that year however was the hot and dry weather pattern never shifted resulting in the worst U.S corn yield in 17-years (123.1 bpa; lowest since 1995/96’s 113.5 bpa). I would argue however 2012/13 remains the outlier with the vast majority of recent historical evidence siding with good early planting progress leading to at least trend-line or better U.S. corn yields.
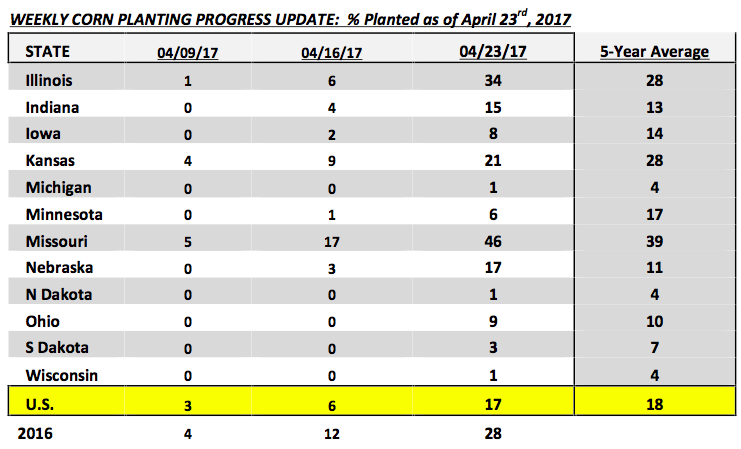
Fast forward to present, Monday’s Weekly Crop Progress report showed U.S. corn planting progress at 17% complete as of April 23rd versus 28% a year ago and 18% on average. The trade was actually looking for a number closer to 12 to 14%. Therefore despite planting progress being slightly better than expected the market’s attention immediately shifted to NOAA’s 6 to 10-day and 8 to 14-day weather forecasts, both of which showed above-normal precipitation for large sections of the Corn Belt. This in turn suggested that future corn planting progress could then be hindered through at least May 9th. That said the question now becomes, “Will 50 to 60% of the U.S. corn crop be seeded by May 10th and if it isn’t could this prompt the USDA to trim its early yield forecasts for the 2017/18 U.S. corn crop?” Corn Bulls are certainly hoping this more price supportive below-trend yield narrative starts to gain traction…
CORN FUTURES PRICING CONSIDERATIONS
July corn futures (CN7) closed on Friday (4/28) at $3.66 ½ finishing up 2 ¾-cents per bushel week-on-week.
Key takeaways from this week’s price action:
- This week’s price action was dominated by two competing storylines. On Monday and Tuesday corn futures rallied on account of NOAA’s extended weather models for the U.S Midwest (6 to 10-day and 8 to 14-day forecasts), both of which suggested a continuation of wet/cold weather conditions, specifically for the Eastern Corn Belt. Invariably this would slow corn planting progress and in certain areas increase the probability of eventual acreage switching from corn to soybeans. By Wednesday however that storyline was shelved in favor of a report suggesting the White House was in the process of drafting a plan to withdraw from NAFTA, which invariably would have major implications on U.S. – Mexico trade relations. The National Corn Growers Association was quick to issue a strong rebuke regarding this possibility considering nearly 30% of all U.S. corn exports go to Mexico. Not surprisingly, corn futures responded Wednesday by largely giving back all of Tuesday’s gains. On Thursday however President Trump “tweeted” that after receiving calls from the President of Mexico and Prime Minster of Canada he had agreed to renegotiate NAFTA versus “terminate” it. Corn futures closed back in green figures that afternoon with traders apparently feeling more secure about NAFTA’s survival…at least until President Trump’s next tweet.
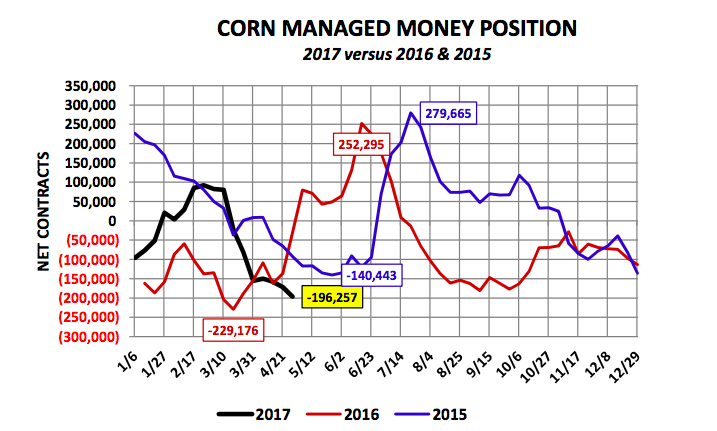
- Clearly the fundamental news at present is a mixed bag…perceived plantings delay providing support on price breaks versus the potential loss of U.S. corn export business to Mexico capping rallies. That said if we step back and look at the price action in July corn futures over an extended period of time, from October 3rd, 2016 through the close on this Friday, April 28th, 2017 July corn futures have traded in a low-to-high range of just 36 ½-cents per bushel ($3.57 ¼ – $3.93 ¾ with a 4/28 close of $3.66 ½ CN7). Point being the market really hasn’t gone much of anywhere in the past 7-months and yet Friday’s Commitment of Traders report as of 4/25/17 showed the Managed Money short in corn futures growing to -196,257 contracts. This representing the largest net short position Money Managers have carried since March 8th, 2016 (-229,176 contracts). Therefore from purely a technical point of view, the one encouraging sign for Corn Bulls is that July corn futures not only closed higher week-on-week despite the presence of an increasing Managed Money corn short, but have also avoided making a new contract low in July corn futures ($3.40 ¼ on 8/31/16).
I still believe this is a market that wants to rally and will rally at the first sign of even a perceived versus actual weather concern this spring / early summer; the “money” is now overweighted to the short side of the market.
Thanks for reading.
Twitter: @MarcusLudtke
Author hedges corn futures and may have a position at the time of publication. Any opinions expressed herein are solely those of the author, and do not in any way represent the views or opinions of any other person or entity.
Data References:
- USDA United States Department of Ag
- EIA Energy Information Association
- NASS National Agricultural Statistics Service

 Flirting With Critical Support… Again")


