March corn futures moved higher this week, closing up 11 ¼-cents per bushel week-on-week, finishing on Friday (1/20) at $3.69 ¾. With the January WASDE report now distinctly in the rearview mirror, the market focus shifted this week to more positive pricing trends for both U.S. corn demand and potentially planted corn acreage in 2017.
STRONG U.S. CORN-ETHANOL DEMAND CONTINUES: On Wednesday, the E.I.A.’s Weekly Petroleum report once again offered a record high weekly U.S. ethanol production rate of 1.054 million barrels per day (for the week ending 1/13/2017).
This marked the 3rd consecutive week of a new record high being established. And while Corn Bulls continued to cheer strong U.S. corn-ethanol production, the sustainability of current run-rates will now start to be questioned with U.S. ethanol inventories also exploding higher. U.S. ethanol stocks were estimated at 21.115 million barrels, up 2.437 million barrels since December 30th, 2016. This is the highest stocks figure the market’s seen since July 15th, 2016. Higher ethanol production without a near equal demand offset will invariably over time put pressure on spot ethanol prices, as well as, gross ethanol margins. Furthermore, U.S. gasoline demand was estimated at just 8.069 million barrels per day for the same week, the lowest weekly gas demand figure since February 14th, 2014.
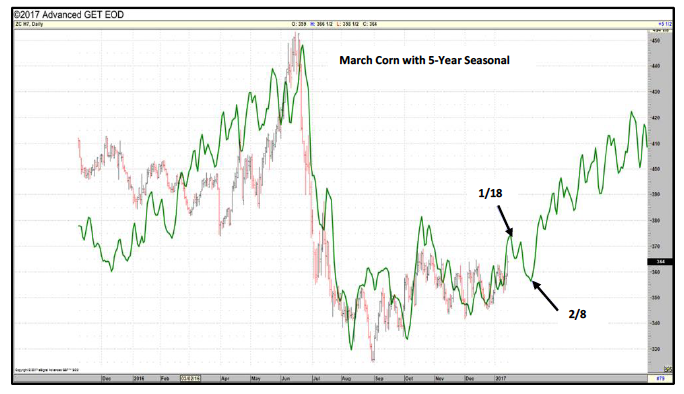
Corn Futures Seasonality Chart
SIZING UP 2017 U.S. ACREAGE PROSPECTS
I fully expect increasing trade discussion to center around 2017 U.S. acreage prospects, and more specifically the U.S. corn and soybean acreage balance, as we inch closer to February and March. I’ve been mentioning for weeks I truly believe the argument for corn rallies above $4.00 per bushel in December 2017 corn futures strengthens as attention moves away from burdensome 2016/17 U.S. and World corn ending stocks. That said…what’s likely going to be the key catalyst creating a transition to a more price supportive forward view on U.S. corn prices?
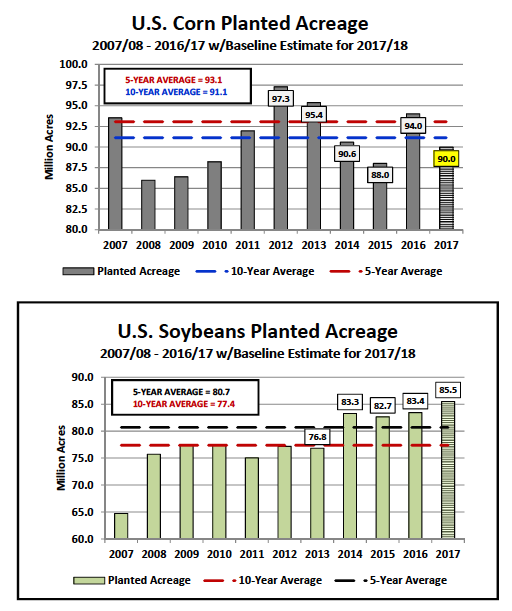
The immediate talking point is clearly the current expectation for a sharp reduction in U.S. corn planted acreage in 2017. The USDA’s “Baseline” acreage estimates released in November suggested 2017/18 U.S. planted corn acreage of 90 million acres, down 4 million acres from 2016/17. In that report the USDA went on to forecast 2017/18 U.S. corn production of 14,060 million bushels via a yield of 170.8 bushels per acre, which if realized would equate to a crop year on-year decrease in total production of 1,088 million bushels or -7.2% (2016/17 U.S. corn production was finalized at 15,148 million bushels in January). That’s hardly an inconsequential reduction when considering that the production differential alone would represent 46.2% of the U.S.’s current corn ending stocks estimate of 2,355 million bushels.
Could U.S. corn planted acreage decrease more than 4 million acres this spring? I do think that’s a possibility. The USDA’s 2017/18 “Baseline” U.S. acreage estimate for soybeans was 85.5 million acres (up 2.1 million acres from 2016); however some recent private estimates have been as high as 90 million acres. It should then be noted that corn and soybeans compete for acres every spring with price often playing a vital role relative to influencing which way a farmer tweaks his/her acreage balances up or down as the planting season approaches.
That said given the chance this week to lock-in a November 2017 soybeans futures sale/hedge at approximately $10.30 per bushel, I would have to assume a fair percentage of U.S. farmers have already taken advantage of the opportunity to secure what is (at least on paper) a positive ROI in soybeans for 2017. By comparison last year November soybeans futures didn’t trade above $10.30 per bushel until May 10thand yet U.S. farmers still planted a record 83.4 million soybean acres in 2016. With December 2017 corn futures showing an inability to break through key overhead technical resistance just under $4.00 per bushel, November 2017 soybeans futures seem to be generating much more producer optimism at the moment, as far as, securing profits is concerned for 2017/18.
Key takeaway as it relates to corn futures prices…longer-term any additional slippage in 2017 U.S corn acreage below 90.0 million acres due to current economics favoring soybeans could actually prove to be the fuel for rallies above $4.00 to $4.50 per bushel in CZ7 this summer and fall. Corn’s spring acreage loss is corn futures summer and fall price gain over time…
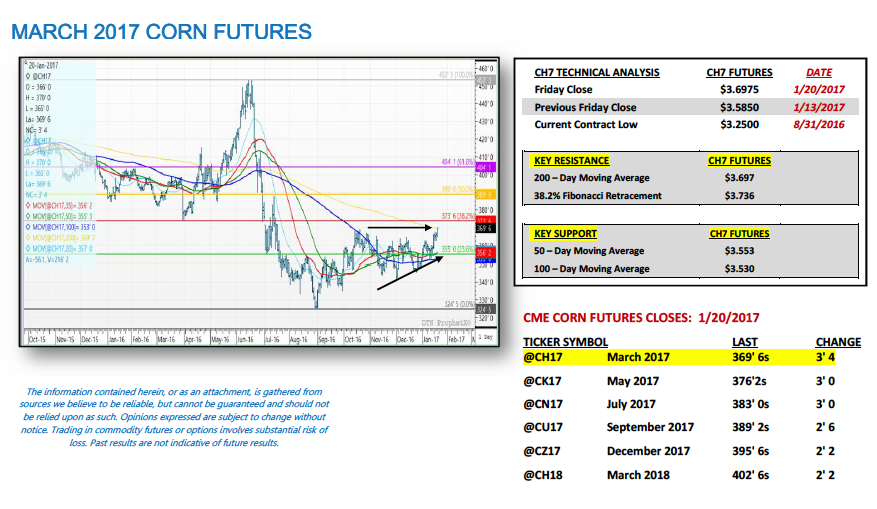
March 2017 Corn Futures (CH7) Price Considerations For The Week Ending 1/20: March corn futures (CH7) closed on Friday (1/20) at $3.69 ¾ finishing up 11 ¼-cents per bushel week-on-week.
Key takeaways from this week’s price action:
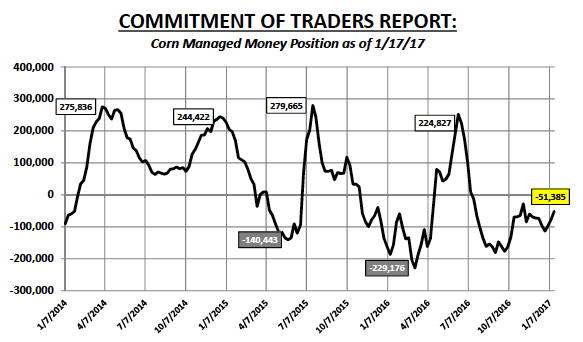
- Friday’s Commitment of Traders report showed the Managed Money net corn short position shrinking to just -51,385 contracts as of the market close on 1/17/2017. Money Managers were therefore net buyers of 25,180 corn contracts week-on-week. This represents the smallest net short position Money Managers have carried in corn since 11/8/2016 (-28,054 contracts). Will this pattern of covering shorts continue? I touched on this briefly last week; however I’m still not convinced now is the time Money Managers will square their short positions or even look to go net long. On page 1, the 5-year price seasonal shows March corn futures rallying into approximately January 18th before correcting back downward into February 8th. This pattern seems to offer a strong correlation to present. The insinuation then is that corn futures could start experiencing a sell-off early next week. Last year Money Managers did something similar trimming their net short corn positions into the 3rd week of January before eventually returning as aggressive sellers. In 2016 the Managed Money net corn short actually increased February forward, peaking on 3/8 at -229,176 contracts.
- That said the key difference between 2017 and 2016 remains… that being the expected 4 to 5 million U.S. corn planted acreage reduction this spring. This could prove to be the major underlying fundamental price support that creates just enough buying below the market to prevent the seasonal downward correction in corn futures over the next 3-weeks. Long-term I still favor the long side of the corn market. Ultimately it’s a matter of timing my entry point with the goal being to own corn on weakness on breaks back to key price support versus chasing it here at what is the topside of the current trading range.
Next week is crucial to March corn futures breaking out of its current trading range to the upside… CH7 closed right on the 200-day moving average ($3.697) Friday afternoon.
Thanks for reading.
Twitter: @MarcusLudtke
Author hedges corn futures and may have a position at the time of publication. Any opinions expressed herein are solely those of the author, and do not in any way represent the views or opinions of any other person or entity.
Data References:
- USDA United States Department of Ag
- EIA Energy Information Association
- NASS National Agricultural Statistics Service

: Worrisome to Broader Market?")
