July corn futures closed UP 3 ½-CENTS per bushel week-on-week, finishing at $4.06.
The 4 dollar threshold continues to serve as important psychological resistance. Can bulls overcome it?
Here’s a rundown of the latest corn market highlights and what I’m watching:
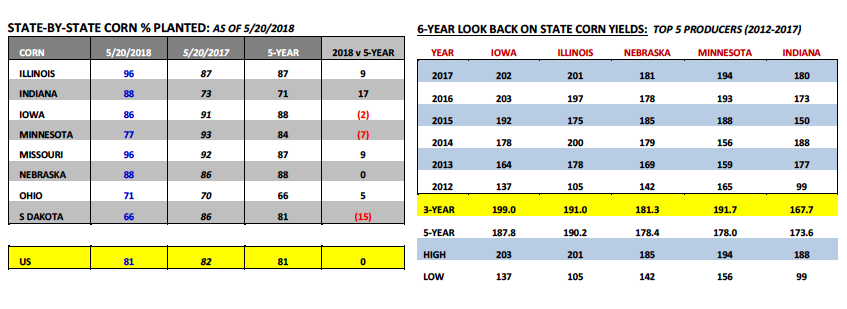
U.S. Corn Planting Progress Now Equal to 5-Year Average: Monday’s Weekly Crop Progress report showed U.S. corn planting progress improving to 81% for the week ending May 20th, 2018 versus 82% last year and 81% on average. The two key corn producing states that needed to catch up were Minnesota and South Dakota. Minnesota’s corn planting progress improved to 77%, up 37% from the previous week, and now just 7% behind its 5-year average.
Meanwhile South Dakota’s corn planting progress was reported at 66%, up 45% from the previous week, and 15% behind its 5-year average. Furthermore Illinois and Indiana remain in a favorable position to add acres in my opinion with Illinois’s corn crop already 96% planted and Indiana at 88%. I’m still a firm believer that total U.S. corn acreage will increase a minimum of 500k acres in the USDA’s June 29thAcreage report versus the current forecast of 88.0 million.
Key Corn States to Watch this Summer: Looking back on the 2017/18 crop year on a state-by-state level, it’s relatively easy to see how the U.S. was able to achieve a new record high corn yield. The top 5 U.S. corn producing states (Iowa, Illinois, Nebraska, Minnesota, and Indiana) collectively averaged a corn yield of 187.1 bushels per acre on 57.43 million harvested corn acres (69.4% of the total U.S. corn harvested acreage base). Each of those states either established a new record high corn yield in 2017 (IL and MN) or their 2ndbest yield ever (IA, IN, and NE). In 2017/18 U.S. corn production reached 14.604 billion bushels and of that total nearly 61% came from Iowa, Illinois, Nebraska, Minnesota, and Indiana.
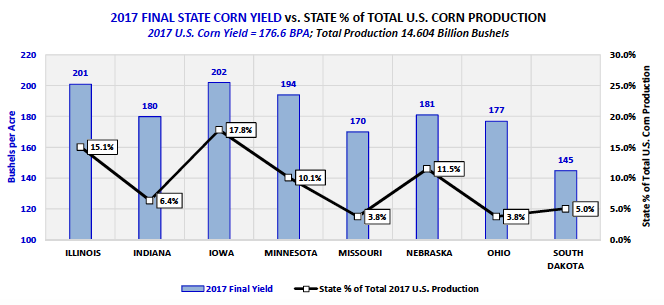
That said as we look toward the 2018 summer growing season and those 5 states specifically I’m of the opinion that outside of Minnesota, the others have been able to get the majority of their intended corn acres planted in a timely fashion. Furthermore NOAA’s current Drought Monitor and Sub-Soil Moisture maps show few if any major areas of concern with June directly ahead. Therefore at this time I haven’t seen anything to discount the possibility of the U.S. achieving the USDA’s trend-line yield forecast of 174 bpa for 2018/19 (issued in the May 2018 WASDE report). Obviously the most critical development stages are still to come; however I think most would agree, the Midwest corn growing season is off to an ideal start in nearly all of the key corn producing states in the country.
Crop Condition Ratings Likely Starting Tuesday:Next Tuesday’s Weekly Crop Progress report (released a day late due to the Memorial Day holiday) is expected to offer the initial “good-to-excellent” rating for the 2018 U.S. corn crop. Last year the U.S. corn crop was rated 65% good-to-excellent on May 28th, 2017. Right now the trade is anticipating a good-to-excellent rating closer to 70% for this year’s starting point. Overall it will be interesting to see how the USDA progresses this summer as it relates to its crop conditions ratings. In 2017 the USDA was much maligned for what traders felt (myself included) was a very misleading interpretation of the quality of the 2017 U.S. corn crop. For example even as late as September 3rd, 2017, the 2017 U.S. corn good-to-excellent rating was still just 61% compared to 74% for the same week in 2016. And as we now know the 2017/18 U.S. corn yield was later finalized at a new record high of 176.6 bpa, 2 bpa higher than 2016/17 (the previous high-water mark). That said I’m guessing the USDA could over-correct the other way (overly optimistic) based on them completely missing the mark in 2017. We shall see…
JULY 2018 CORN FUTURES PRICE FORECAST:
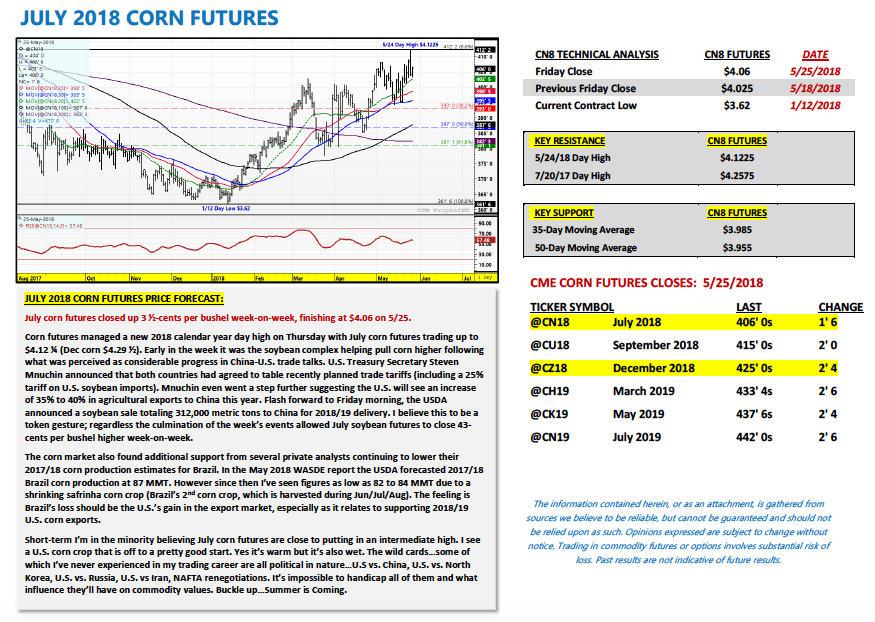
July corn futures closed up 3 ½-cents per bushel week-on-week, finishing at $4.06 on 5/25.
Corn futures managed a new 2018 calendar year day high on Thursday with July corn futures trading up to $4.12 ¼ (Dec corn $4.29 ½). Early in the week it was the soybean complex helping pull corn higher following what was perceived as considerable progress in China-U.S. trade talks. U.S. Treasury Secretary Steven Mnuchin announced that both countries had agreed to table recently planned trade tariffs (including a 25% tariff on U.S. soybean imports). Mnuchin even went a step further suggesting the U.S. will see an increase of 35% to 40% in agricultural exports to China this year. Flash forward to Friday morning, the USDA announced a soybean sale totaling 312,000 metric tons to China for 2018/19 delivery. I believe this to be a token gesture; regardless the culmination of the week’s events allowed July soybean futures to close 43-cents per bushel higher week-on-week.
The corn market also found additional support from several private analysts continuing to lower their 2017/18 corn production estimates for Brazil. In the May 2018 WASDE report the USDA forecasted 2017/18 Brazil corn production at 87 MMT. However since then I’ve seen figures as low as 82 to 84 MMT due to a shrinking safrinha corn crop (Brazil’s 2ndcorn crop, which is harvested during Jun/Jul/Aug). The feeling is Brazil’s loss should be the U.S.’s gain in the export market, especially as it relates to supporting 2018/19 U.S. corn exports.
Short-term I’m in the minority believing July corn futures are close to putting in an intermediate high. I see a U.S. corn crop that is off to a pretty good start. Yes it’s warm but it’s also wet. The wild cards…some of which I’ve never experienced in my trading career are all political in nature…U.S vs. China, U.S. vs. North Korea, U.S. vs. Russia, U.S. vs Iran, NAFTA renegotiations. It’s impossible to handicap all of them and what influence they’ll have on commodity values. Buckle up…Summer is coming.
Twitter: @MarcusLudtke
Author hedges corn futures and may have a position at the time of publication. Any opinions expressed herein are solely those of the author, and do not in any way represent the views or opinions of any other person or entity.
Data References:
- USDA United States Department of Ag
- EIA Energy Information Association
- NASS National Agricultural Statistics Service
: Creating Bullish Divergence?")


: Creating Bullish Divergence?")