December corn futures moved lower this week, closing down 7-cents per bushel week-on-week, finishing on Friday (8/4) at $3.81.
Corn futures proved unable to manage a higher weekly close even with Informa and others issuing sizable U.S. corn yield decreases in anticipation of next week’s August Crop Production report. My 2017/18 U.S. corn yield and production estimates for August are as follows…
PRE-AUGUST 10TH U.S. CORN PRODUCTION REPORT OUTLOOK
Let’s start with what we know? We know that the 2017 U.S. corn crop is currently rated just 61% good-to-excellent as of the week ending July 30th, 2017 versus 76% in 2016, 70% in 2015, 75% in 2014, and 63% in 2013. Therefore this year’s corn crop on paper is the worst rated crop the U.S. has experienced since the devastating drought in 2012.
That said the challenge is trying discern just how bad “61% good-to-excellent” is. Reason being the U.S. has been spoiled the last 3-crop years with record to near record corn yields of 171.0 bushels per acre in 2014, 168.4 bpa in 2015, and 174.6 bpa in 2016. Collectively those are the 3 highest U.S. corn yields ever and they all came in succession. Therefore I believe both traders and crop analysts alike are having a hard time recalibrating their “good-to-excellent” expectations in 2017 based on what had been an incredible run of uneventful, benign summer growing seasons.
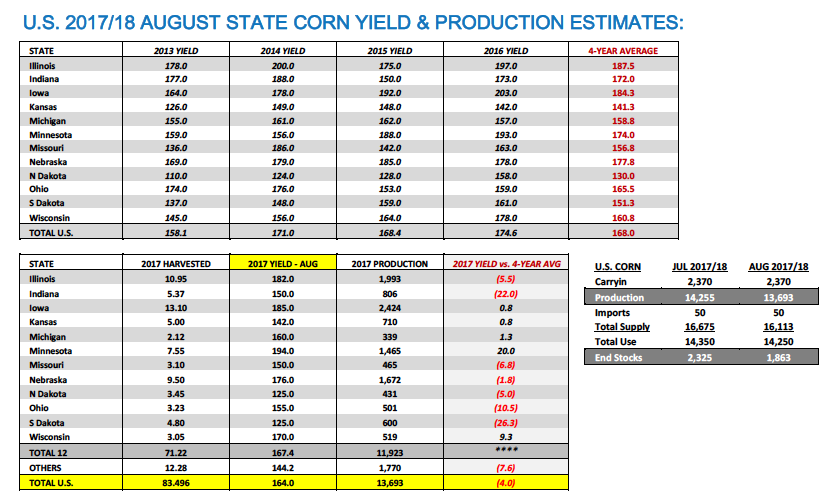
That said the return to a more diversified 2017 summer growing season has led to a wide discussion on yield prospects for states such Iowa and Illinois, the 2 largest corn producing states in the country. Iowa has seen its good-to-excellent rating in corn decrease 13% during the month of July. However with 65% of Iowa’s crop still technically rated good-to-excellent, it’s far from a disaster. Therefore what type of corn yield do we then attach to Iowa for the August Corn Production report? If crop ratings are the barometer for determining yield potential we know that last year at this time Iowa’s corn crop was rated 83% good-to-excellent, which eventually led to a final state yield in 2016 of 203 bushels per acre. Conversely we also know that in 2013 Iowa’s corn crop was rated just 53% good-to-excellent as of July 28th, 2013, which in turn resulted in a final state yield of 164 bpa.
Therefore this would seem to suggest that for 2017 based on current crop condition ratings Iowa’s corn yield is likely to fall in a range of 175 to 185 bushels per acre. However the challenge is a 10 bpa low-to-high yield swing in a state as large as Iowa (which is expected to harvest 13.1 million corn acres this fall) equates to a production differential of approximately 130 million bushels. This type of production skew would have a material influence on total U.S corn production and total U.S. corn ending stocks for 2017/18.
A similar total U.S. production/ending stocks impact also applies to Illinois with its anticipated 10.95 million harvested corn acres for 2017. Illinois’s current corn good-to-excellent rating of 63% is down from 83% in 2016 but just 1% below the 64% good-to-excellent rating Illinois maintained in 2013, which produced a final state corn yield of 178 bpa (again far from a disaster). That said I’d put the current range for Illinois’s state corn yield for 2017 at a comparable 175 to 185 bpa, which would result in a possible production differential of 110 million bushels. The overall point being once again that for 2017, traders are literally having this same discussion on as many as 8 key corn producing states in the country. This invariably means then depending on what side of the low-to-high state yield range a crop analyst falls on for the August Corn Production report, this decides whether or not they come up with a U.S. corn yield forecast as low as 158 bpa or as high as 166 bpa for 2017/18.
With those challenges in mind for August I am currently forecasting the 2017/18 U.S. corn yield at 164.0 bpa for total production of 13.693 billion bushels versus the USDA’s July forecasts of 170.7 bpa and 14.255 billion bushels. I am however also lowering total U.S. corn demand 100 million bushels to 14.25 billion bushels. Therefore as it relates to the 2017/18 U.S. corn carryout I still have ending stocks at a sufficient 1.863 billion bushels versus the USDA’s July estimate of 2.325 billion.
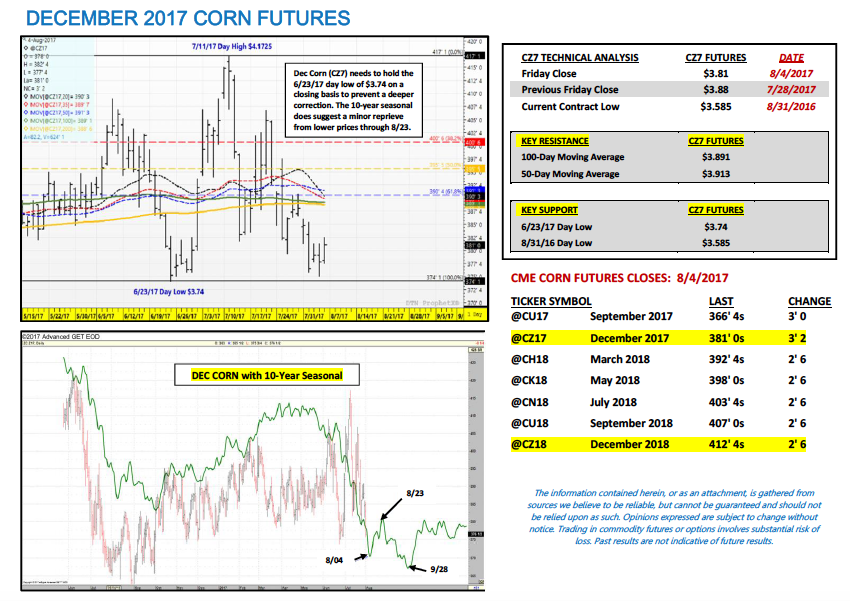
Is this Bullish corn prices? The short answer is likely not beyond 20 to 30-cents from current price levels. It still doesn’t support December corn futures sustainably above $4.00 in opinion; however what it does provide is a higher harvest price floor. In 2016 December corn futures drifted down below $3.20 per bushel during the last few trading days of August. I do NOT expect a repeat performance in 2017. I look for the selling pressure to slow on futures price breaks below $3.70 to $3.60 December corn futures. Furthermore if the USDA trims the U.S. corn yield 6 to 7 bpa in the August report, Corn Bulls will likely immediately push the narrative toward another yield decline coming in September. This too should make Corn Bears hesitate before extending short positions below the $3.70-$3.60 price ranges.
In 2015 the lowest December corn futures traded was $3.56 per bushel on November 10th. The August low in December corn futures that year was $3.57 ½ (U.S. corn ending stocks in 2015/16 were 1.737 billion bushels). I would anticipate a similar price response/floor in 2017.
Thanks for reading.
Twitter: @MarcusLudtke
Author hedges corn futures and may have a position at the time of publication. Any opinions expressed herein are solely those of the author, and do not in any way represent the views or opinions of any other person or entity.
Data References:
- USDA United States Department of Ag
- EIA Energy Information Association
- NASS National Agricultural Statistics Service


 and Semiconductors (SMH): Concerning Price Pattern?")


