U.S. Corn Weekly Highlights and Outlook:
On Thursday (10/12) the USDA released the October 2017 WASDE report, which contained updated national and state yield / production estimates for both corn and soybeans.
The highlights are as follows:
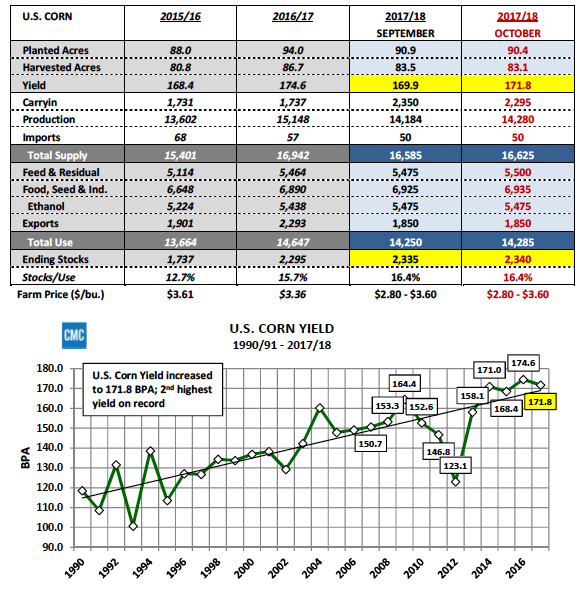
In corn the USDA increased the 2017/18 U.S. corn yield to 171.8 BPA versus its September forecast of 169.9 bpa. If realized the USDA’s October yield projection would be the second highest ever trailing only 2016/17’s final yield of 174.6 BPA. Total U.S. corn production was raised to 14.280 billion bushels, up 96 million bushels month-on-month. A percentage of the yield increase as it relates to its positive impact on total U.S. corn production was offset due to decreases in both planted and harvested acreage. 2017 U.S. corn harvested acreage was reduced to 83.119 million acres versus 83.496 in September (-337,000 acres).
Notable state harvested corn acreage declines occurred in Iowa (-200,000 acres), Nebraska (-200,000 acres), Indiana (-150,000 acres), Ohio (-100,000 acres), and North Dakota (-260,000 acres). Conversely South Dakota saw its harvested corn acreage base improve +450,000 acres versus September to 5.25 million acres.
NASS’s revised October 2017 state-by-state corn yield estimates revealed yield increases for 4 of the top 5 U.S. corn producing states versus a month ago. Iowa’s corn yield was up +4 BPA, increasing to 191 BPA. Illinois’s corn yield increased +3 BPA to 192 BPA. Minnesota and Indiana’s state corn yield forecasts were both raised +2 BPA to 184 BPA and 173 BPA respectively. Also of note, Missouri enjoyed a corn yield increase of +8 BPA to 172 BPA. If realized this would be Missouri’s 2nd highest yield ever trailing only 2014’s final state yield of 186 BPA. Overall NASS’s positive national yield adjustment exceeded the average trade guess by +1.7 BPA (average trade guess = 170.1 BPA).
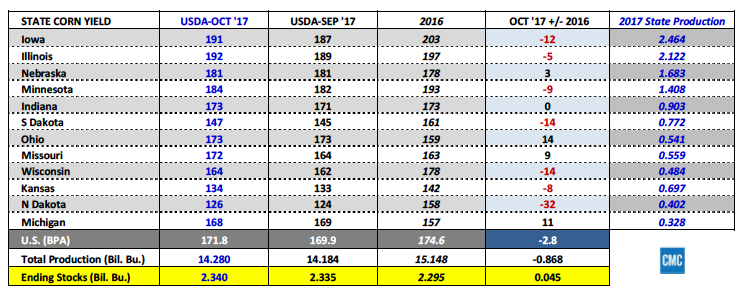
2017/18 U.S. corn ending stocks increased just 5 million bushels month-on-month to 2.340 billion bushels, which compares to 2.295 billion bushels in 2016/17 and 1.737 billion bushels in 2015/16. The 2017/18 U.S. corn stocks-to-use ratio improved to 16.4%, the highest since 2005/06’s figure of 17.5%.
In soybeans the USDA lowered the 2017/18 U.S. soybean yield to 49.5 BPA versus its September forecast of 49.9 bpa and the average trade guess of 50 BPA. The USDA did increase planted and harvested acreage (harvested +740,000 acres; 89.471 million versus 88.731 million in September). The acreage increase allowed 2017/18 U.S. soybean production to remain unchanged month-on-month at 4.431 billion bushels versus 4.296 billion in 2016/17 and 3.926 billion in 2015/16. Carryin stocks however fell to 301 million bushels versus 345 million in September. That said the net impact on 2017/18 U.S. soybean ending stocks was a decrease of 45 million bushels versus a month ago, resulting in a carryout of 430 million bushels. This figure was also 17 million bushels below the average trade guess of 447 million. Traders rewarded the October U.S. soybean S&D adjustments with a 26 ¾-cents per bushel higher close on Thursday afternoon (SX7 closed at $9.92).
December Corn Futures (CZ7) Short-Term Outlook
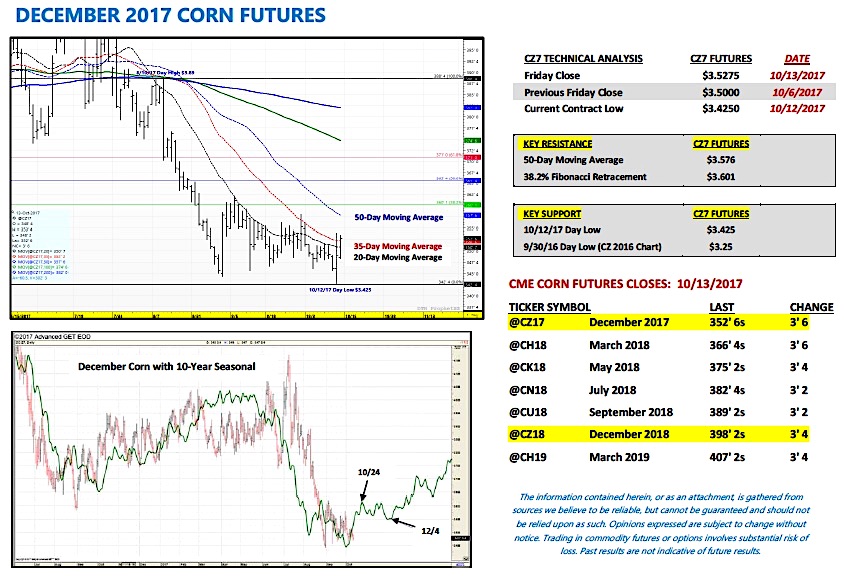
December corn futures closed up 2 ¾-cents per bushel week-on-week, finishing on Friday at $3.52 ¾. Despite what was largely considered a Bearish October WASDE report for the corn market, corn futures managed to rally 6 ¾-cents since the release of the report on Thursday mid-morning. That said I would argue corn owes nearly 100% of its upward price movement on Thursday and Friday to the rally in soybeans.
TECHNICALLY… December Corn futures (CZ7) did finally manage to push through and close over both the 20-day and 35-day moving averages. If corn can open higher on Monday the next area of topside price resistance is the 50-day moving average at $3.57 ¾ followed by the 38.2% Fibonacci retracement at $3.601. I’m still not a believer that corn can run too far to the upside at this time given the massive crop in the field.
The one hope for Corn Bulls… Friday’s Commitment of Traders report showed the Managed Money short in corn increasing to -162,937 contracts as of the market close on 10/10/17. That’s the largest short money managers have carried in corn since June 2nd, 2017 (-200,981 contracts). Last year from 9/27 through 11/1 money managers reduced their short corn position exposures by +111,836 contracts. Additionally on Thursday December corn futures made a new contract low of $3.42 ½; however CZ7 responded by closing 10 ¼-cents above that level by Friday afternoon. IF traders believe the “harvest low” is now in at $3.42 ½, it’s entirely possible money managers will start to buy back a healthy percentage of their net short over the next 30-days. I can see them doing this even with a negative/Bearish 2017/18 U.S. corn S&D profile.
Thanks for reading.
Twitter: @MarcusLudtke
Author hedges corn futures and may have a position at the time of publication. Any opinions expressed herein are solely those of the author, and do not in any way represent the views or opinions of any other person or entity.
Data References:
- USDA United States Department of Ag
- EIA Energy Information Association
- NASS National Agricultural Statistics Service


