 In this article I would like to focus on two excellent stock market indicators I use to determine whether a trend is strong or weakening. But before we dive into these select stock market indicators, let’s review my prior publication, “Stock Market Indicators Point to Slowing Momentum.” In that article, I suggested that the market was going to take a rest, which it did. It has since reloaded and moved to new all-time highs, showing the strength of the underlying trend.
What is interesting to me is how many traders and analysts continue to try and short every possible top. By viewing this quote from my last article, “Until the dip buyers become exhausted and the bears take control, there is no reason to go against the overall market strength,” one can see that I continue to believe this is still the case because the dip buyers’ mentality is still intact (as is the trend).
That said, it is still extremely important to understand the underlying strength or weakness in the markets. Gauging strength allows us to adjust our risk leashes (and portfolios) as conditions warrant; and to “prepare” for potential change and the stock market indicators change. Here are two primary stock market indicators that I use when gauging market strength/weakness:
- NYSE Advance/Decline Line
- Cumulative 4 Week New High/New Low indicator.
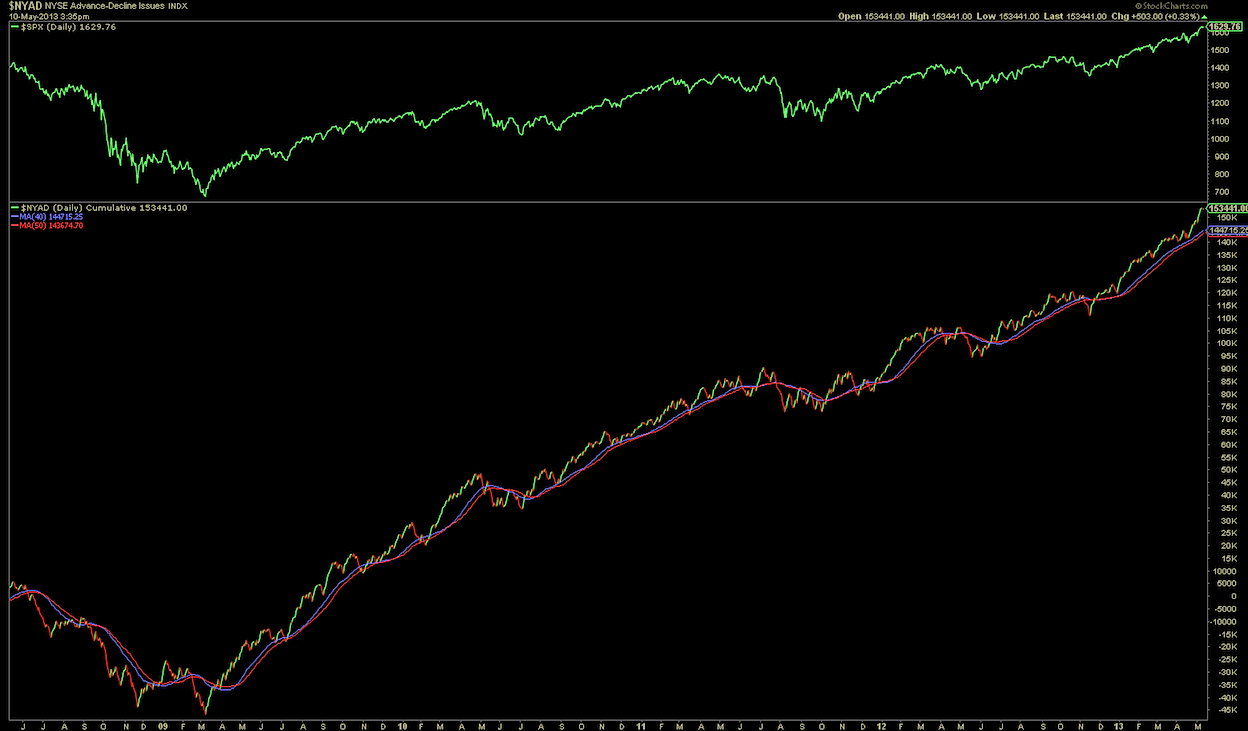
Let us begin by taking a look at the NYSE Advance/Decline (A/D) Line. This quantifies the amount of advancing issues minus the declining issues. I use a 40 Day Simple Moving Average as a gauge as to whether the trend is strong or weakening. As the A/D line approaches the 40 Day MA or breaks it, I remain cautious and start to watch other confirming signals as well. Click images to enlarge.
Stock Market Indicators – NYSE Advance/Decline Line
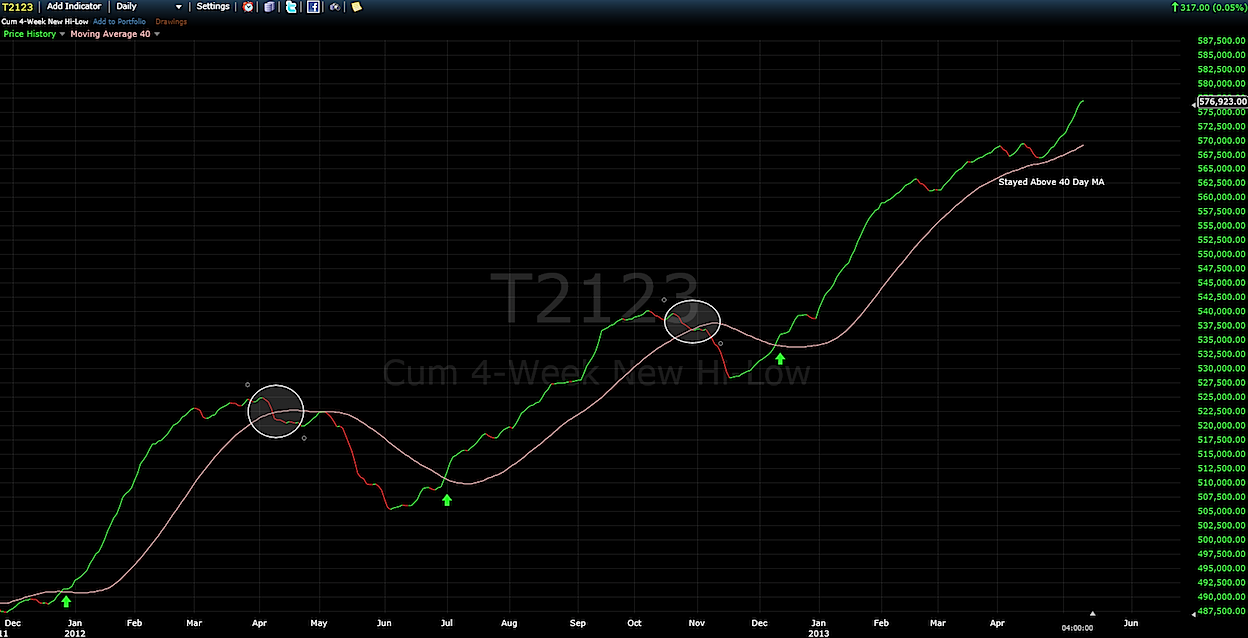
The Cumulative 4 Week New High/New Low indicator is the difference between the number of issues reaching new highs and the number of issues reaching new lows over a 4 week period. Again, I also use a 40 Day Moving Average to determine possible turning points in the market. As you can see on the chart below, the circles depict key turning points in the market. The arrows point to a break of the 40 Day MA to the upside.
Stock Market Indicators – Cumulative 4 Week New High/New Low
Remember, the trend is your friend. Don’t fight it.
Disclaimer: The material provided is for informational and educational purposes only and should not be construed as investment advice. All opinions expressed by the author on this site are subject to change without notice and do not constitute legal, tax or investment advice. At Castle Financial, securities are offered through Cadaret, Grant & Co., Inc. and TD Ameritrade, Inc. Members FINRA/SIPC.
Chart sources: stockcharts.com and freestockcharts.com
Twitter: @stockpickexpert and @seeitmarket
Any opinions expressed herein are solely those of the author, and do not in any way represent the views or opinions of any other person or entity.

: Showing Some Signs of Emerging Strength")
