 By Korey Bauer The S&P 500 Index is up 8.91% year-to-date and has had a remarkable run in the 1st quarter of 2013. What is interesting is that there have been many cases throughout this rally that stock market indicators have pointed to internal weakness only to see the market continue higher. For example, the sectors that led the market higher in the 4th quarter of 2012 and early part of 2013 are sectors that are consistent in a bull market when global growth is expanding. But what has been interesting is the relative underperformance that has been going on over the past month and half or so in these “previously” leading sectors.
What is also very notable is the outperformance of treasuries relative to small-caps and emerging markets. This kind of disconnect is not consistent with new all-time highs and typically leads to stock market pauses or corrections. I would like to give credit to Michael Gayed, chief investment strategist and co-portfolio manager at Pension Partners LLC, who has published many articles explaining this internal weakness we are currently experiencing at new all-time highs. Many charts I observe on a daily basis seem to be slowing significantly in momentum once again (as I pointed out back in Mid-February) before we had a mini pullback. Will this time be any different? I’m not suggesting the market will undergo a stealth drop but beneath the surface many stock market indicators are flashing caution.
The big question is will the correction come now in April? Historically it doesn’t seem likely that the market will fall just yet because of the April seasonality factor. April tends to be the strongest month going back 20-30 years and seasonality can be very powerful and it’s not something you want to fight. Another reason why I believe the market may not be done with its fantastic run is the fact of continuing top calling as the market goes higher. Each time this has happened this year, it led to another squeeze (leg) higher in the market. Short Interest on the NYSE has risen quite a bit over the last few weeks and we take this as a contrary indicator. Something else that has been consistent this entire year is the “buy the dip mentality,” still seems to be intact. On Friday, we had a strong sell-off in the AM and the market recovered most of its losses by the end of the session. Until the dip buyers become exhausted and the bears take control, there is no reason to go against the overall market strength.
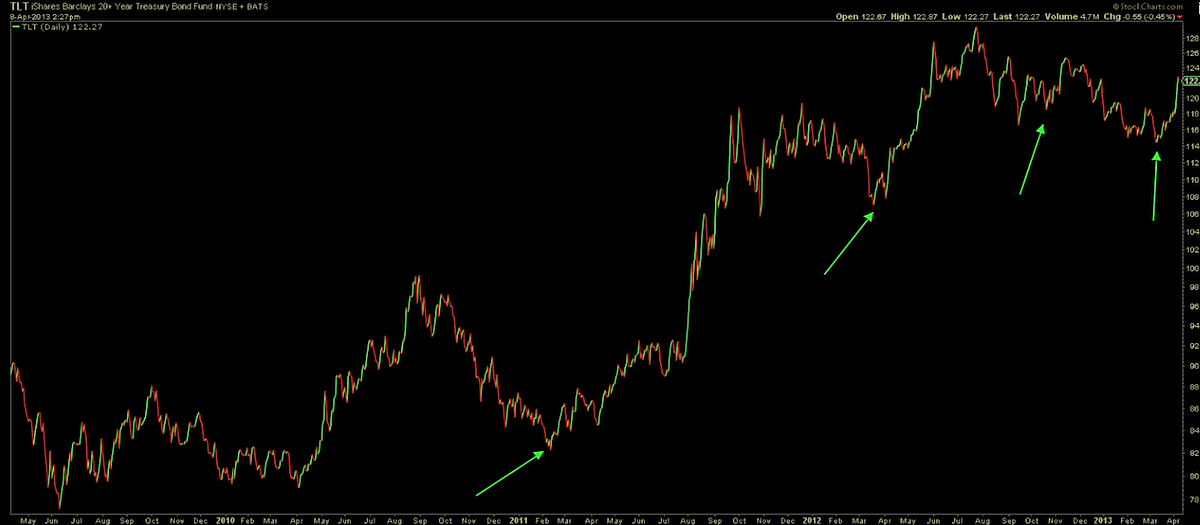
To add to the argument of internal weakness over the last few weeks, we need to take a look at the bond market. The 21-day moving average put/call ratio for bonds (sentiment indicator) reached an extreme oversold reading about 2 weeks ago. This serves as a valuable stock market indicator, as it gives us insight into sentiment extremes, and assists in determining oversold points in the bond market. This is one possible reason for the surge in bond prices over the past 2 weeks – see TLT chart below. (Chart arrows point out oversold conditions)
TLT Bond Chart | Stock Market Indicators
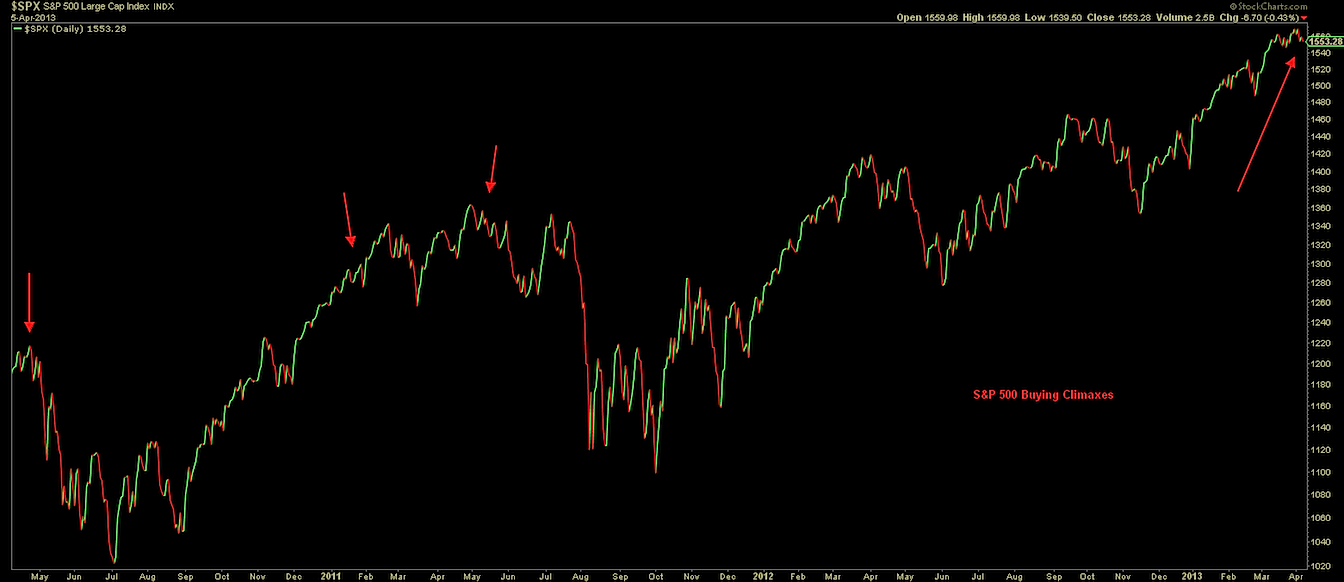
On Friday, the S&P 500 had a surge in buying climaxes. Buying climaxes are when a stock reaches a 52-week high, and then reverses to close lower than the previous week. Take a look at the chart below, as the arrows to point out exhaustion in an upwards move in the S&P 500. Click images to enlarge.
S&P 500 Chart – Buying Climaxes | Stock Market Indicators
With just a few points of data I pointed out, we can see April being a month of frustration for both the bulls and the bears. The market could possibly be putting in an intermediate top as it’s working through the topping process. We may be in the early stages of another head and shoulders topping pattern so this confirms my thoughts that the market may possibly be running out of gas. Until we break this current rising wedge the uptrend is still intact and there is no reason to fight this powerful trend higher. We may very well reverse hard to the upside next week and break the highs as shorts have failed to sustain meaningful pressure on the bulls which continue to squeeze these weak shorts out.
Technicals
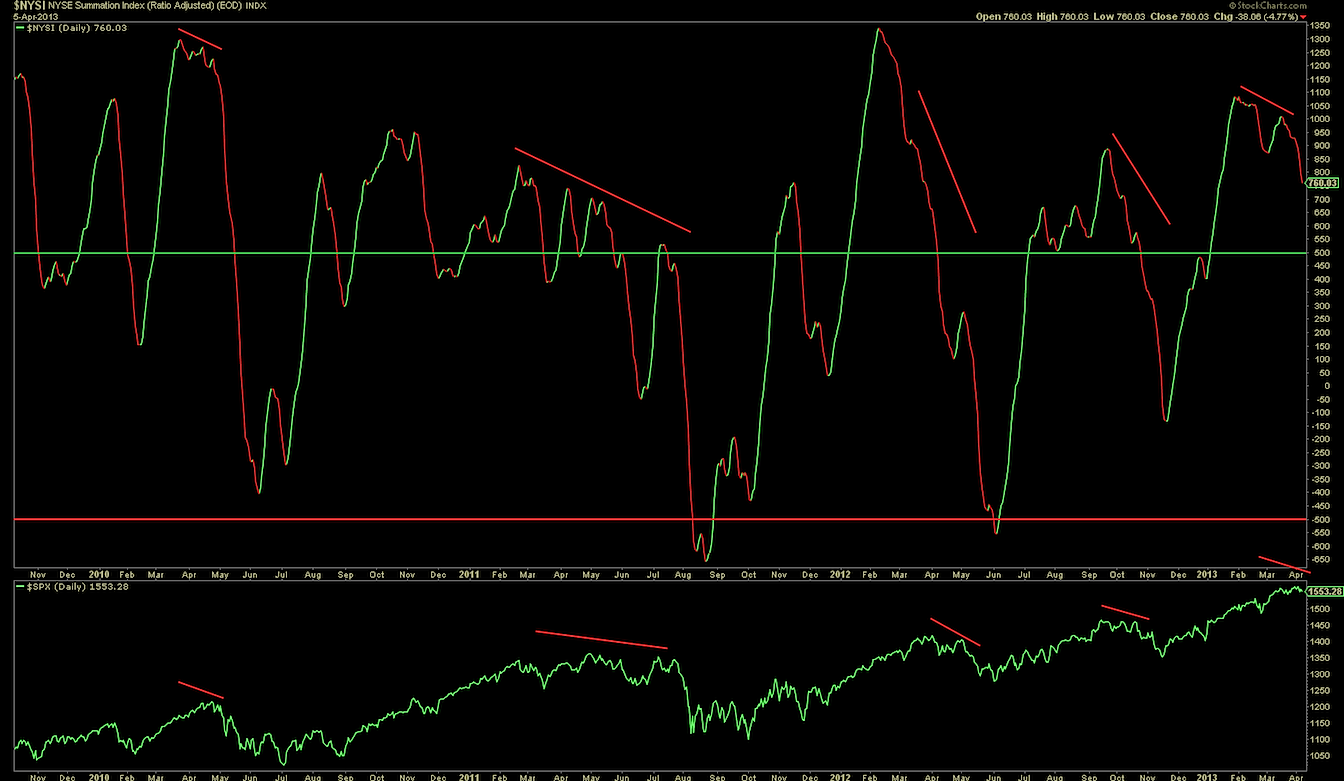
Each push higher seems to be getting more and more exhaustive with less confirmation by the breadth of the market. The NYSE Summation Index is a breadth indicator, which is derived from the daily advances minus declines of the New York Stock Exchange, and is showing negative divergence into these new highs. This is something that we have been monitoring since early February as it continues to deteriorate.
NYSE Summation Chart | Stock Market Indicators
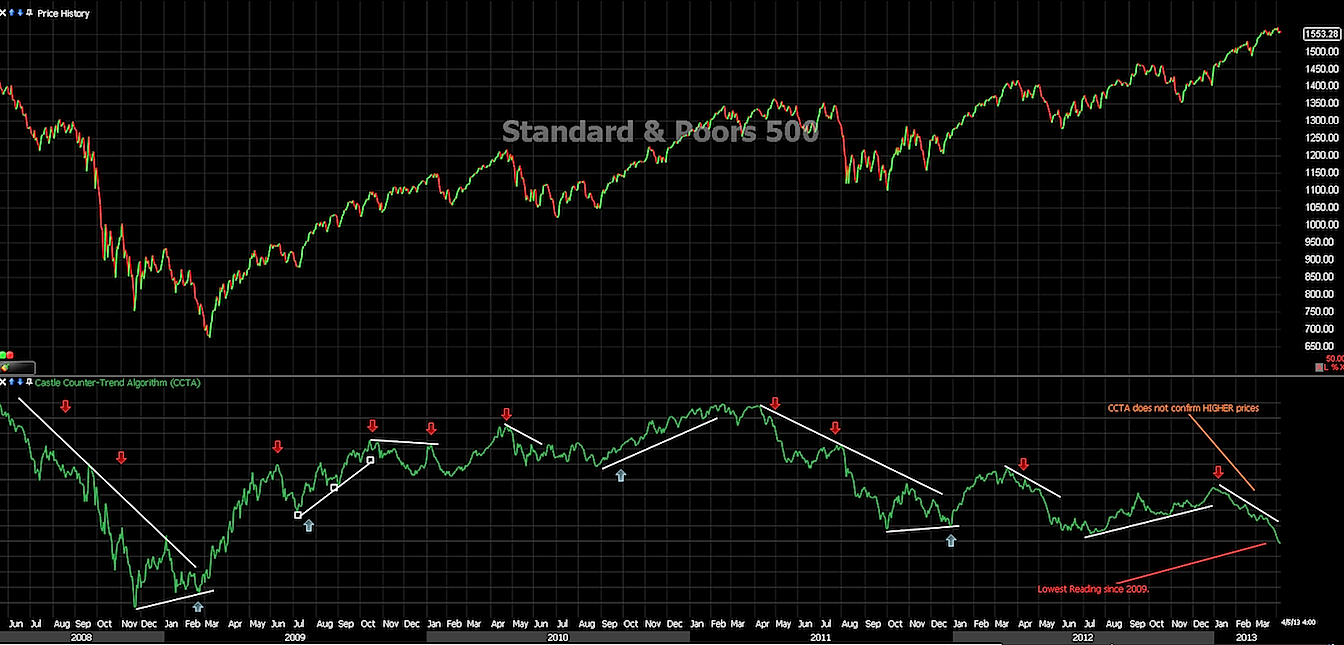
The Castle Countertrend Algorithm (CCTA) is a proprietary tool that we use to look at divergences against the S&P 500. This tool currently just put in a 4 year low as the market makes new highs. By looking at the chart, one can see that this tool depicts some key divergences that have helped to see the underlying weakness in the market.
S&P 500 Chart with CCTA Algo | Stock Market Indicators
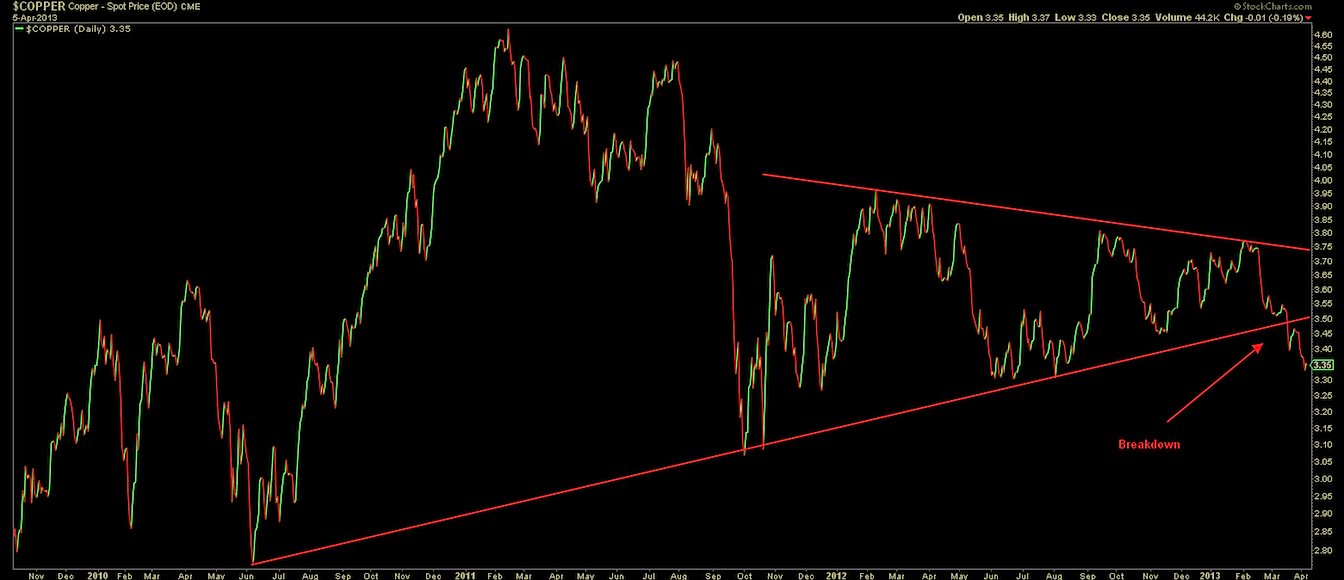
The industrial metal, copper, has shown significant weakness since mid February and hasn’t looked back. Copper is the main component of any emerging or expanding industrial economy, so since this chart shows relative weakness in demand, it is important to consider this factor when viewing the true health of the overall economy. Copper’s weakness has also been attributed to the recent strength in the U.S. dollar, which has been affecting other commodity prices as well.
Copper Chart Breakdown | Stock Market Indicators
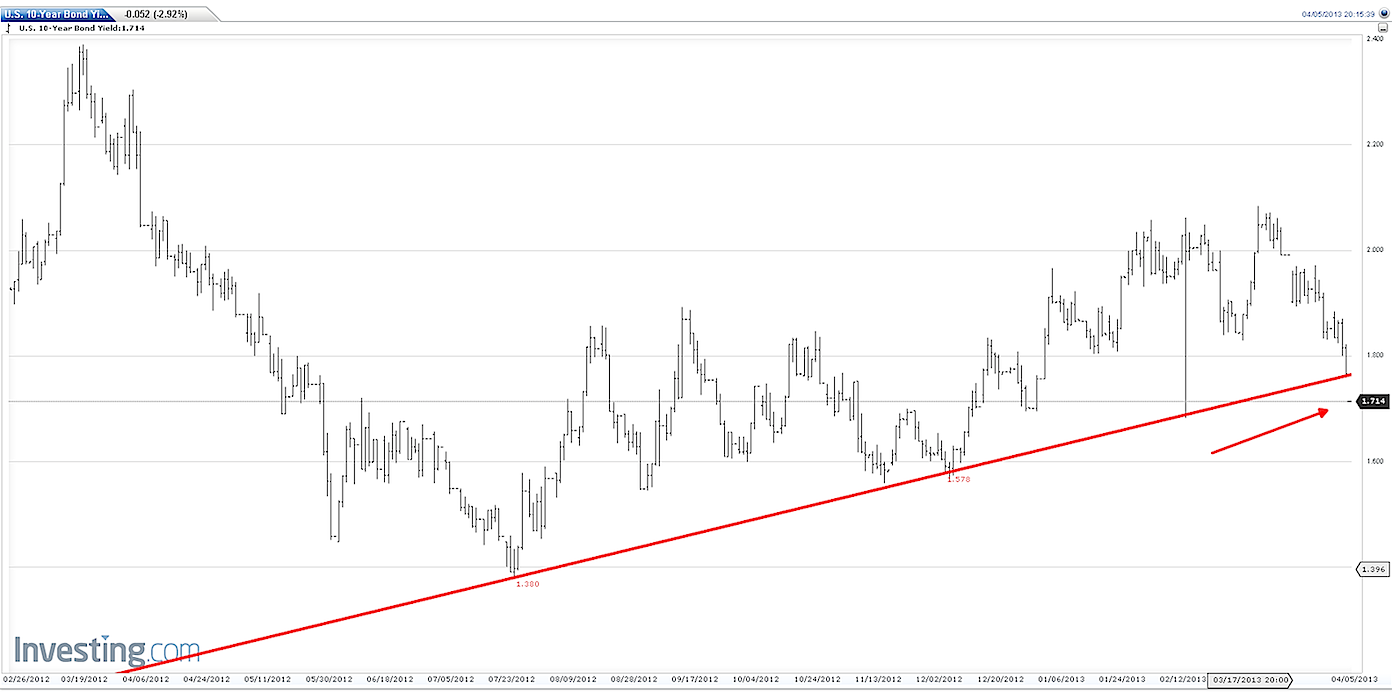
The bond market, unlike the equity markets, has been rallying and yields have been plummeting as the equity markets made new highs. This is not consistent with an equity rally and it seems the bond market was pricing in a negative jobs number as well as the other economic data that has come in very soft this week.
10 Year Yield Chart | Stock Market Indicators
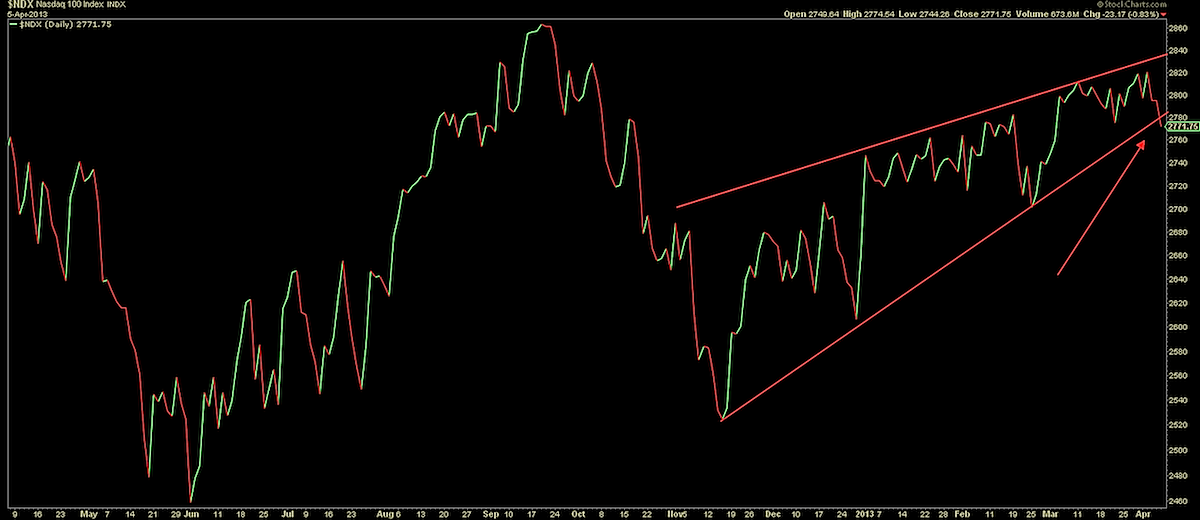
Today, the Nasdaq 100 gapped below its ascending channel as depicted below. Usually price tends to retest the channel once broken, so I’m looking for a bounce here to confirm lower highs in price.
Nasdaq 100 Chart | Stock Market Indicators
Market Leaders now Lagging
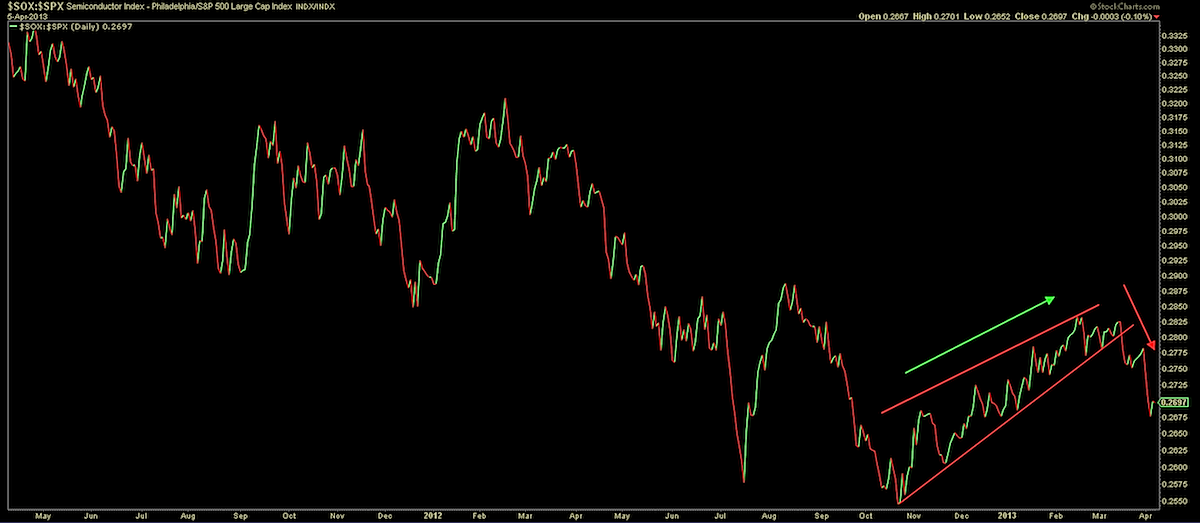
I want to point out one of my personal favorite sectors to measure the health of the trend – The Semiconductors. This chart failed to break the 2011 highs and turned lower and hasn’t looked back since. The Semiconductors were one of the sectors to lead the market higher at the end of 2012 into early 2013.
SOX Semiconductors vs S&P 500 Chart | Stock Market Indicators
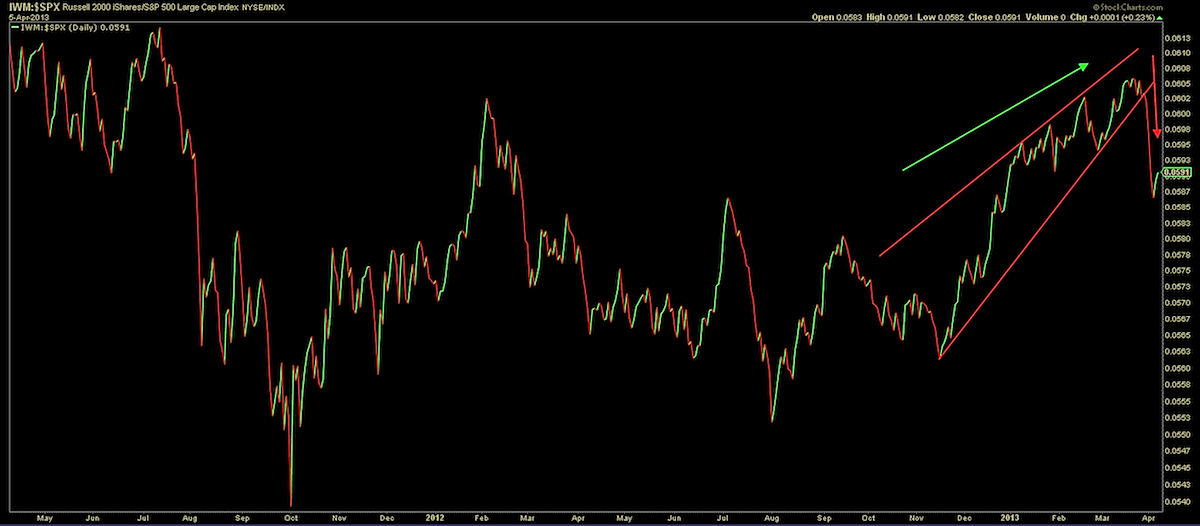
Russell 2000 showing cracks this week as it begins to underperform large cap stocks.
IWM Russell 2000 vs S&P 500 Chart | Stock Market Indicators
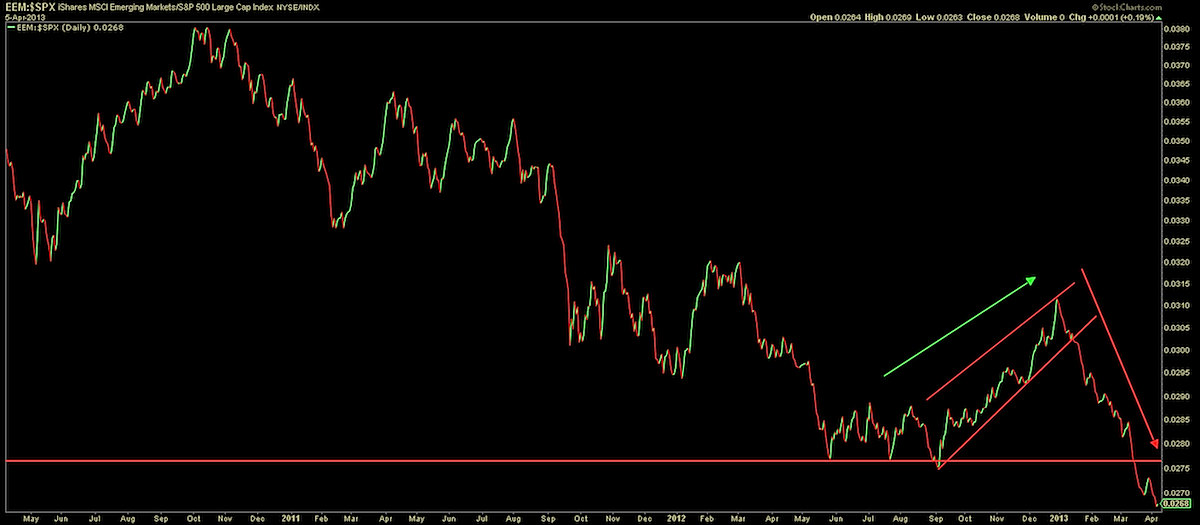
Emerging Markets since the beginning of the year have been relatively weak as well struggling to outperform the S&P 500.
EEM Emerging Markets vs S&P 500 Chart | Stock Market Indicators
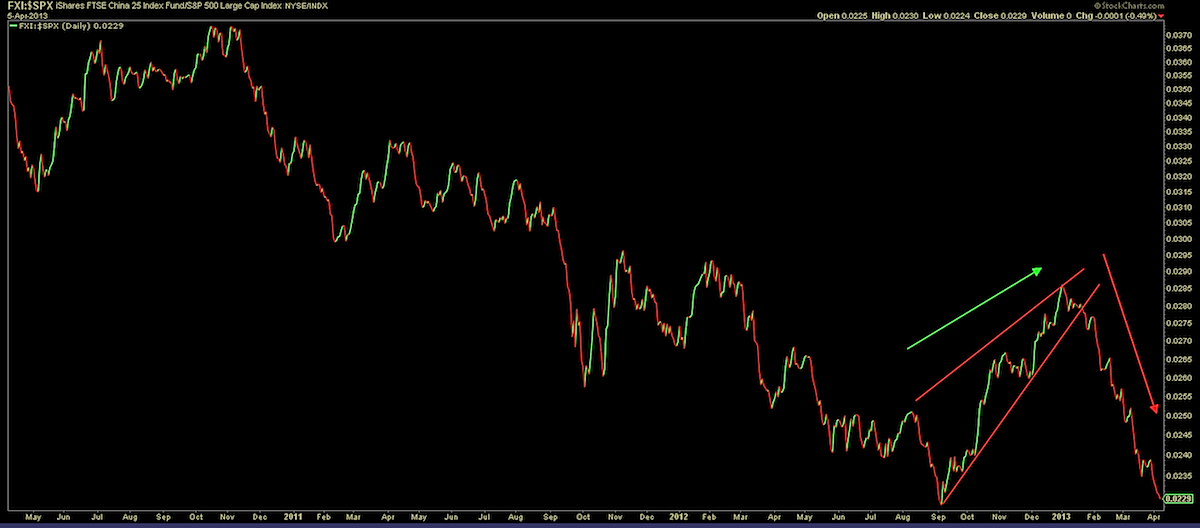
China taking their foot off the gas (QE) to curb inflation has also been very weak.
FXI China 25 Index vs S&P 500 Chart | Stock Market Indicators
One final note, I would like make is that earnings season is right around the corner. This also will play a very important factor that could derail this market rally. Europe and Asian fears will continue send the market tremors and headlines may be the driving force in market sentiment. Keeping an open mind, both bulls and bears have a lot of work to do and until many of these factors gets resolved, we remain cautious in either direction. Be safe.
Disclaimer: The material provided is for informational and educational purposes only and should not be construed as investment advice. All opinions expressed by the author on this site are subject to change without notice and do not constitute legal, tax or investment advice. At Castle Financial, securities are offered through Cadaret, Grant & Co., Inc. and TD Ameritrade, Inc. Members FINRA/SIPC.
Chart sources: stockcharts.com; investing.com (1o year yield); freestockcharts.com (S&P 500 chart with CCTA Algo)
Twitter: @stockpickexpert and @seeitmarket
No position in any of the securities mentioned at the time of publication.
Any opinions expressed herein are solely those of the author, and do not in any way represent the views or opinions of any other person or entity.


: Showing Some Signs of Emerging Strength")
