Technology stocks have been the undisputed leader of the 2019 stock market rally.
The Nasdaq 100 is now within reach of its all-time highs set late last summer.
That’s pretty bullish for this market leading index. But it gets better…
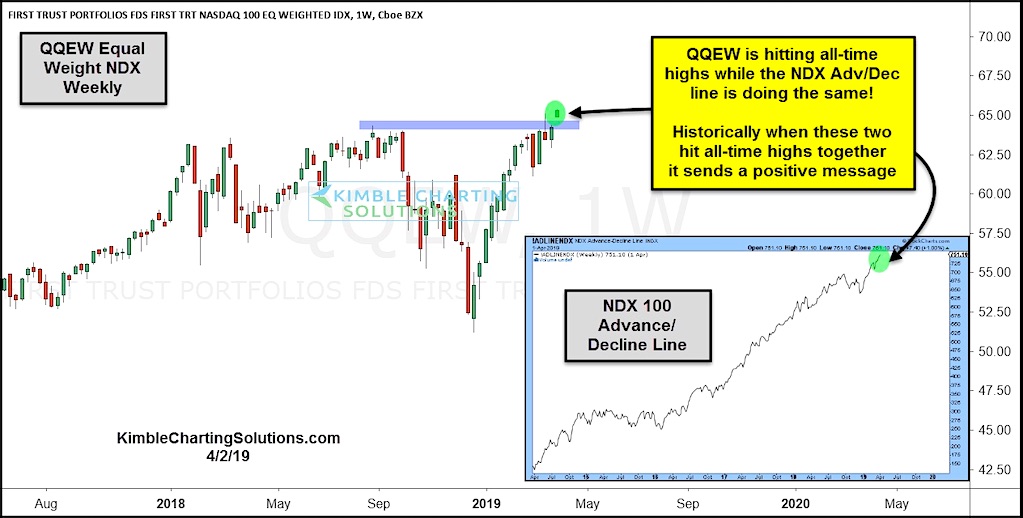
In today’s chart we look at the Nasdaq 100 Equal Weight Index, as well as the Nasdaq 100 Advance-Decline line (advancing stocks vs declining stocks).
The charts are bullish in both cases. The Equal Weight Index is breaking out and the A-D Line is at all-time highs.
The Tech Sector looks to be sending a positive message with these two big-time tech indexes hitting all-time highs together.
Nasdaq 100 Equal Weight Index Chart
Note that KimbleCharting is offering a 2 week Free trial to See It Market readers. Just send me an email to services@kimblechartingsolutions.com for details to get set up.
Twitter: @KimbleCharting
Any opinions expressed herein are solely those of the author, and do not in any way represent the views or opinions of any other person or entity.


: Showing Some Signs of Emerging Strength")
