Treasury bonds have remained on track since our early April post, and we expect a bearish trading environment to persist until August.
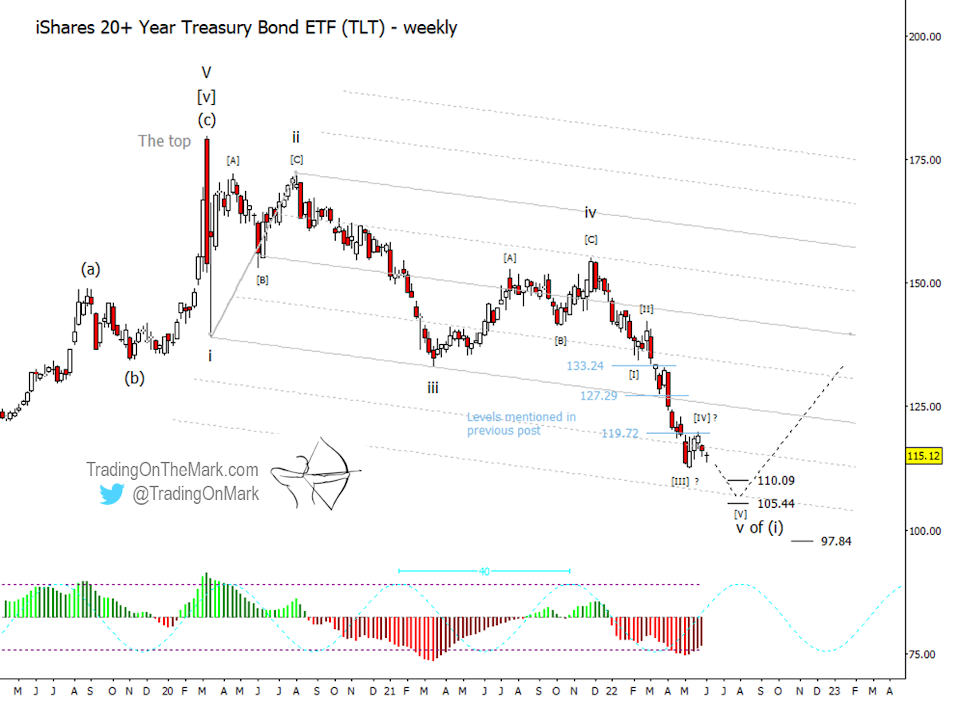
Here we show the updated Elliott wave picture for the iShares 20+ Year Treasury Bond ETF (TLT). The basic wave count remains the same.
Soon after our last post, TLT dropped away from the 133.24 level we highlighted as near-term resistance. You can see on the chart how price went on to move in “stepping stone” fashion through the other levels we mentioned. Usually those levels represent good entry points for traders operating on a slightly faster time frame than the weekly chart they appear on. For example, shorting TLT upon failure of 127.29 or 119.72 would have worked for anyone trading with daily charts or faster.
The easy bear trades might be coming to an end though, as the downward [I]-[II]-[III]-[IV]-[V] pattern approaches completion. We are provisionally expecting TLT to set a low around August of this year, but there’s another scenario that could have the downward pattern persist until the end of the year.
Even though there’s no Fed meeting scheduled for August, several price cycles coincide to have inflection points around that time. For simplicity we show just the 40-week cycle.
Sometimes the highs and lows in cycles correspond to highs and lows in price, but the inflection itself is really the most important part of a cycle. The ideal cycle high projected for August could coincide with a price low. In other words, small downward wave [V] of ‘v’ of (i) might already have started and might continue until the inflection.
The next best alternative would be that wave [IV] isn’t finished yet. The August timing could represent the end of a sideways wave [IV] and the start of downward wave [V]. That might shift the TLT low closer to the end of the year, and we note there’s a Fed meeting in mid-December.
The key message for Elliott wave traders is that the strong downward pressure that produced wave [III] of ‘v’ has probably ended. Any further trades in TLT and treasury bonds this year should be of shorter duration and should be analyzed on a faster chart.
Going forward, important supports await at 110.09, 105.44 and possibly 97.84 as a bearish stretch target. The broken support at 119.72 will probably still have influence if it’s tested again, as will the lower main boundary of the channel drawn on the chart.
Let our Elliott wave analysis give you confidence in your trading. Visit Trading On The Mark and follow us on Twitter.
Twitter: @TradingOnMark
The authors may have a position in the mentioned securities at the time of publication. Any opinions expressed herein are solely those of the author, and do not in any way represent the views or opinions of any other person or entity.


