North American equity markets have continued to show a pretty high level of resilience, weathering rising tariffs, tensions between longtime allies, and random tweets.
On Friday we have President Donald Trump threatening to put tariffs on all Chinese goods and complaining the Fed for raising rates, yet at the time of writing the market is up slightly.
Underpinning this resilience is a solid earnings season so far. It may still be early, with about 1/5th of companies having reported, 94% have surprised to the upside.
Adding to the good corporate news, economic growth appears to be gaining momentum again. For now, this is positive for equities, which will change at some point. Recall global equities experienced a market correction in February, largely triggered by rising bond yields, rising inflationary pressures on the back of robust economic growth.
Since then, over the past five months, the TSX has recovered and made new recent highs while the S&P 500 (NYSEARCA:SPY) is a short stone’s throw from its previous peak. This recovery has occurred in part thanks to bond yields (INDEXCBOE:TNX) retreating somewhat and inflationary pressures softening because global economic growth lost some momentum.
The recent trend over the past few years has been that when inflation fears are elevated softer economic growth is good news for equity markets. Conversely, when inflation fears are low, better data is good.
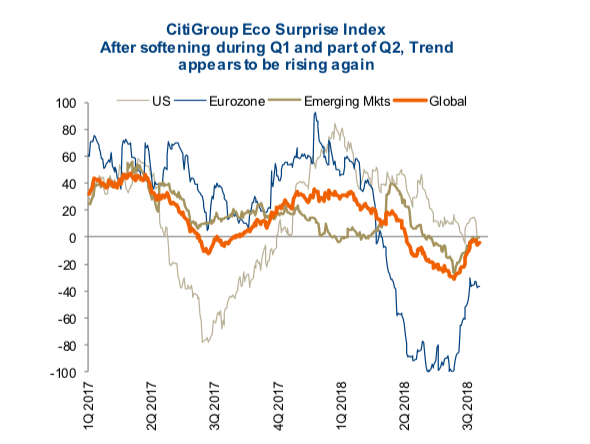
At the moment, the improving data has been positive, which has started to gain momentum in the past few weeks. The chart below shows the Citigroup Economic Surprise indices for the U.S., Eurozone, Emerging Markets, and a global aggregate. As you can see, the momentum of global economic data started to lose momentum during Q1 and part of Q2, but has now started to rise again. As long as bond yields and inflation fears remain contained, markets could enjoy a decent advance here on the back of better data.
Keep Duration Short
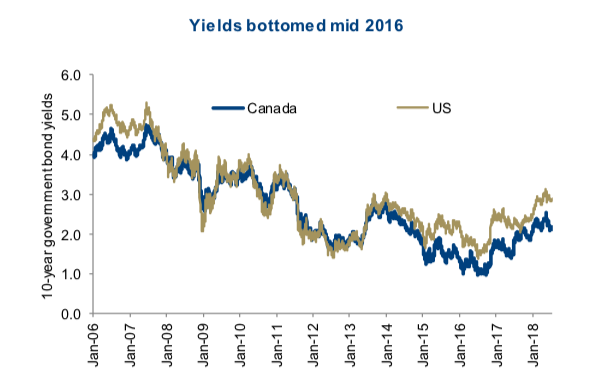
We do remain constructive on equities in the coming quarters, with our biggest concern being the resurgence of inflation pressures/fears. The market appears to have adjusted to bond yields in the range of 2.8-3.1%, measured by the 10-year Treasury. But if the economic data continues to improve, this may give way to inflation fears once again. While it may be counterintuitive, the trade tensions are actually helping keep yields suppressed.
A trade war would certainly be negative for economic growth and that may counter some of the strong data.
There are a number of long-term secular trends that continue to put downward pressure on yields and inflation.
Demographics is a big one. There are simply more savers than borrowers, which makes capital more readily available and therefore lowers the cost (yield) of capital. Also on the wages front, baby boomers are reaching retirement at a faster rate compared to new entrants. This is one of the contributing factors to the gradual decline in the labour participation rates. It impacts wages because those retiring are well paid and those entering are, well, not. If those retiring outnumber entrants, this puts downward pressure on aggregate wages.
Technology is also helping to better allocate capital and asset utilization. Technology in logistics has enabled integrated global supply chains that also help keep input costs lower. Note – a trade war starts to unravel some of this benefit.
But there are counter cycles, even during long-term secular trends. This counter cycle is building and may have some legs. There are the traditional late economic cycle factors including a tight labour market, rising wage pressures, capacity constraints, and rising input costs. An increasing number of companies during the past few earnings seasons have highlighted higher transportation costs, more difficulty finding qualified employees and having to pay more to hire.
There are also some new contributors to upward inflation pressures. While rising tariffs would slow economic growth and alleviate some pressure, they do result in higher costs. Even though the U.S. economy and many others are running near capacity, the U.S. has recently cut taxes and increased fiscal spending. Not very sound policy from an economic perspective. And then there is quantitative easing (QE) transitioning to quantitative tightening (QT). Central bank buying of bonds (QE) has put downward pressure on yields during the past decade. Now we have the U.S. Federal Reserve unwinding to the tune of $40 billion per month, rising to $50 billion in October. Plus the ECB is planning to start tapering its balance sheet later this year. Studies estimate that QE reduced 10- year Treasury yields somewhere between 85-200bps, so QT may cause yields to rise a similar magnitude (we may have already experienced some of this).
Portfolio Implications – We believe higher yields are coming and investors should remain short duration, sacrificing income to better shelter market value, should yields move more than expected. This may play out sooner but growth concerns in emerging markets and trade tensions could easily delay till 2019.
The Danger of Short Term Memories
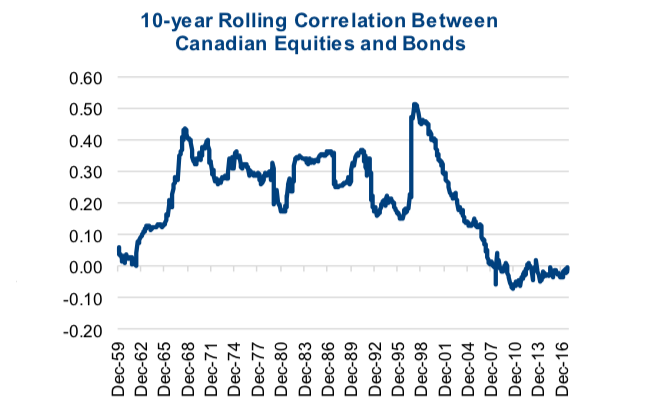
If you ask most investors, they will believe they own bonds for some income (sadly less than years past) and to provide a stabilizer for when equities decline. This belief has been reinforced repeatedly over the past couple of decades. When equity markets declined, bond markets rose (aka yields declined), softening the blow to your portfolio. The rolling 10-year correlation between monthly Canadian equity returns and Canadian bond returns can be seen in the graph below. The 10-year correlation started declining at the turn of the century and has remained below 0 for most of the past 20 years. The graph also shows that this correlation was positive in the 1970s and 1980s. It means that, very often during this period, when equity markets were falling, so were bonds.
The difference between the two periods comes down to why the markets are moving up or down. During the past couple of decades, we have been in a very low inflationary environment and lower economic growth. Deflation has tended to be a bigger fear than inflation. Most periods of equity market weakness were triggered because growth was faultering, which means yields fell and bond prices rose. In the 70s and 80s, most periods of market weakness were triggered due to inflation fears, which often led to falling equity prices and falling bond prices. Or at least bonds were not providing nearly as good a portfolio stabilizer.
If inflation fears do rise up again in the coming years, even on a cyclical basis, the broader bond market may not be the stabilizer it has been in the past. What worked best in the 70s and 80s, short-term bonds/cash and commodity exposure did well.
Once again, on the bond side of your portfolio, get shortie.
Charts are sourced to Bloomberg unless otherwise noted.
Twitter: @sobata416 @ConnectedWealth
Any opinions expressed herein are solely those of the authors, and do not in any way represent the views or opinions of any other person or entity.


