Back in mid-December, I provided a ‘heads up’ that the bonds were oversold and that active investors should expect a bounce.
The levels highlighted in that post worked and treasury bonds (NASDAQ:TLT) are currently in the midst of a bounce.
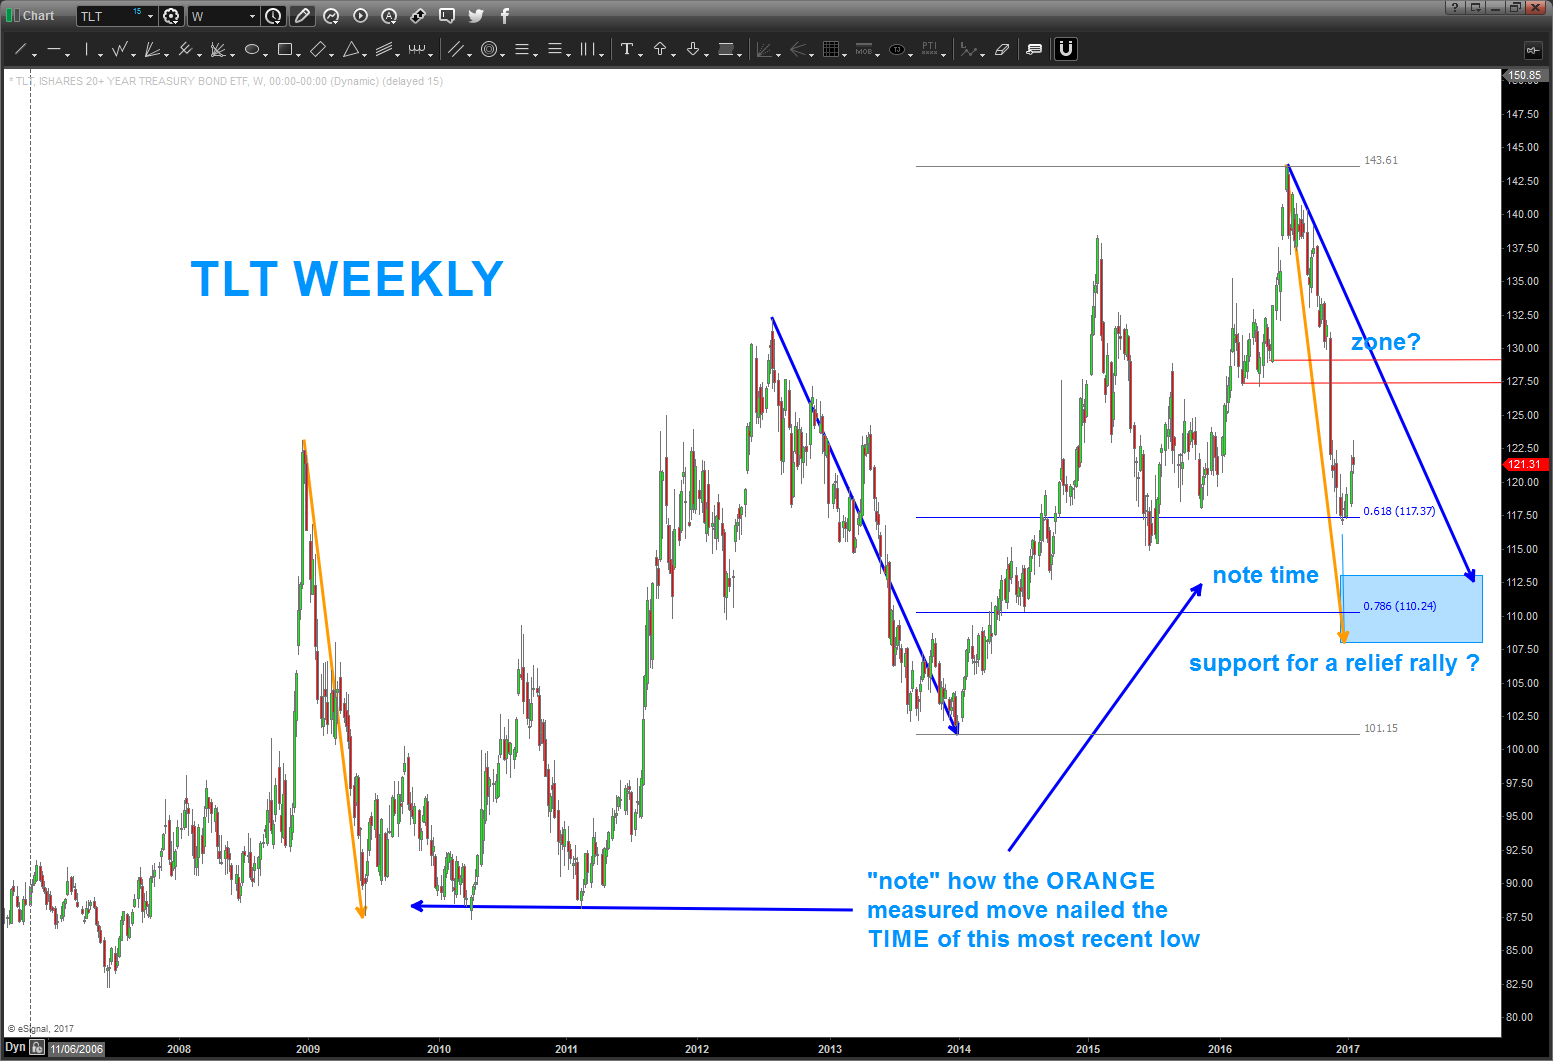
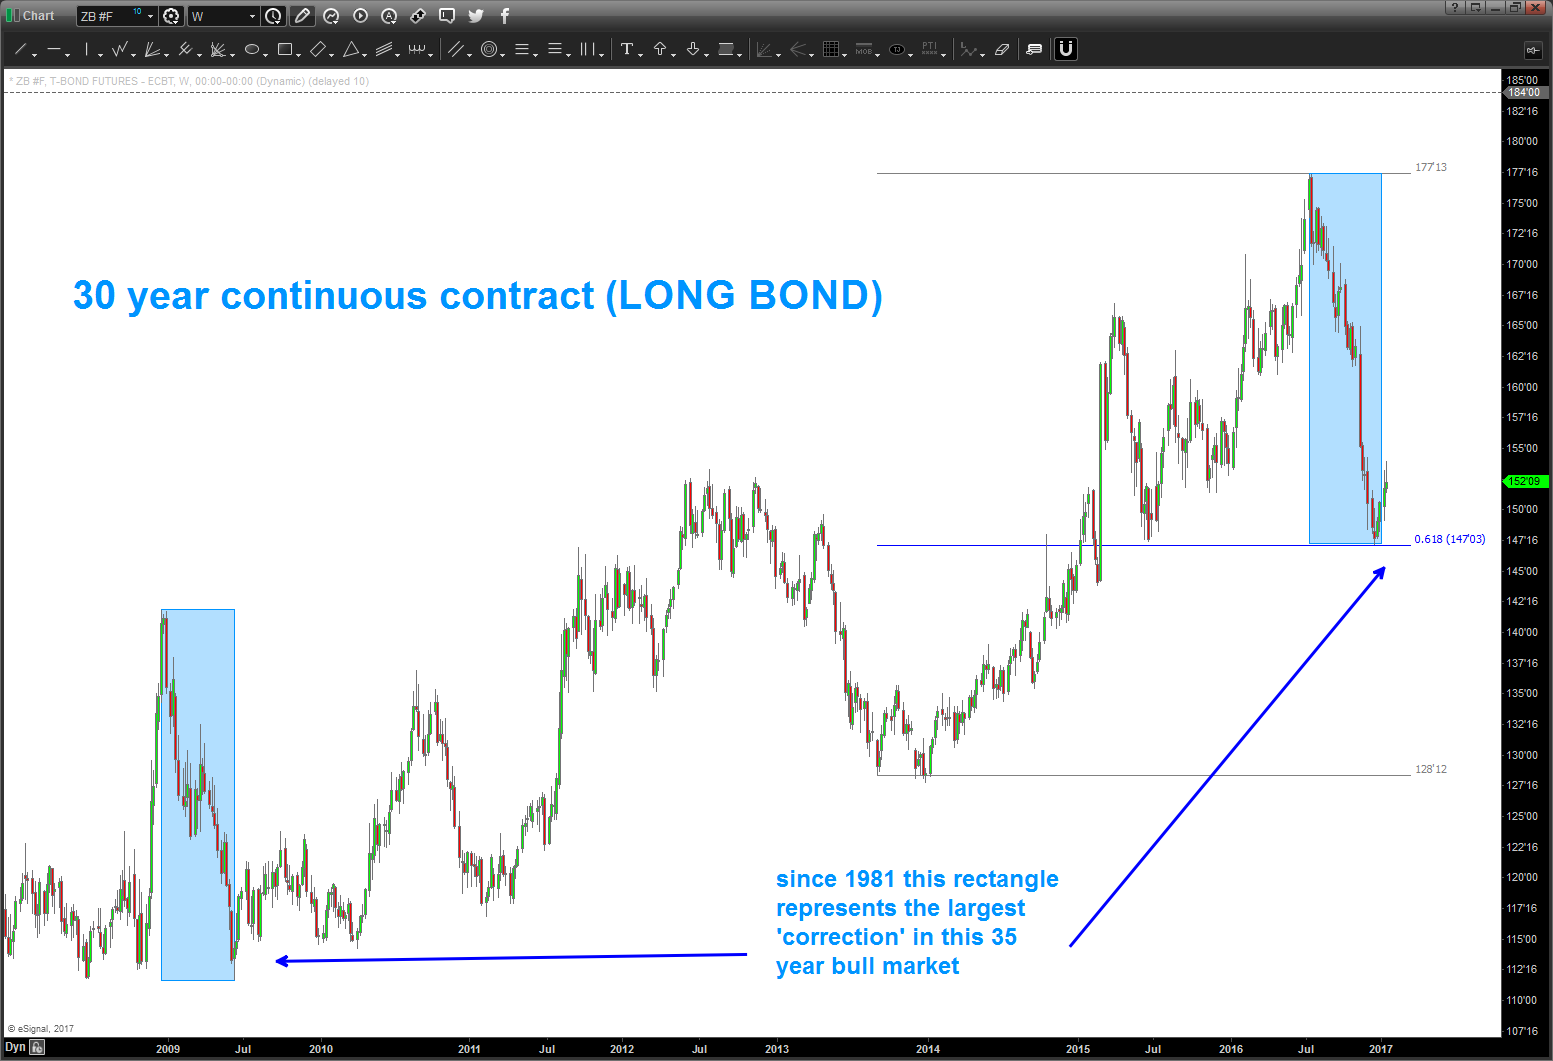
Right now, I believe there is more work to be done on this rally before trying to short again. Below are two charts of “long bonds”: the 20+ year treasury bonds ETF (TLT) and the 30 year treasury bond continous contract. They include potential upside targets and treasury bonds lower price targets for 2017. These charts simply serve as an interim update on my thoughts.
20+ Year Treasury Bonds ETF (TLT) Chart
30 Year US Treasury Bond Continuous Contract Chart
Thanks for reading.
Twitter: @BartsCharts
Author does not have a position in mentioned securities at the time of publication. Any opinions expressed herein are solely those of the author, and do not in any way represent the views or opinions of any other person or entity.

: Showing Some Signs of Emerging Strength")
