If you took advantage of our bearish forecast for treasury bonds in August, congratulations on catching a great trade! We believe the downward move is coming to an end now, so this post presents a near-term bullish forecast for the iShares 20+ Year Treasury Bond ETF (TLT).
We also wanted to provide an example of how Elliott wave analysis can help you find trades even when the overall picture isn’t perfectly clear, so this post includes a primary scenario and an alternative scenario.
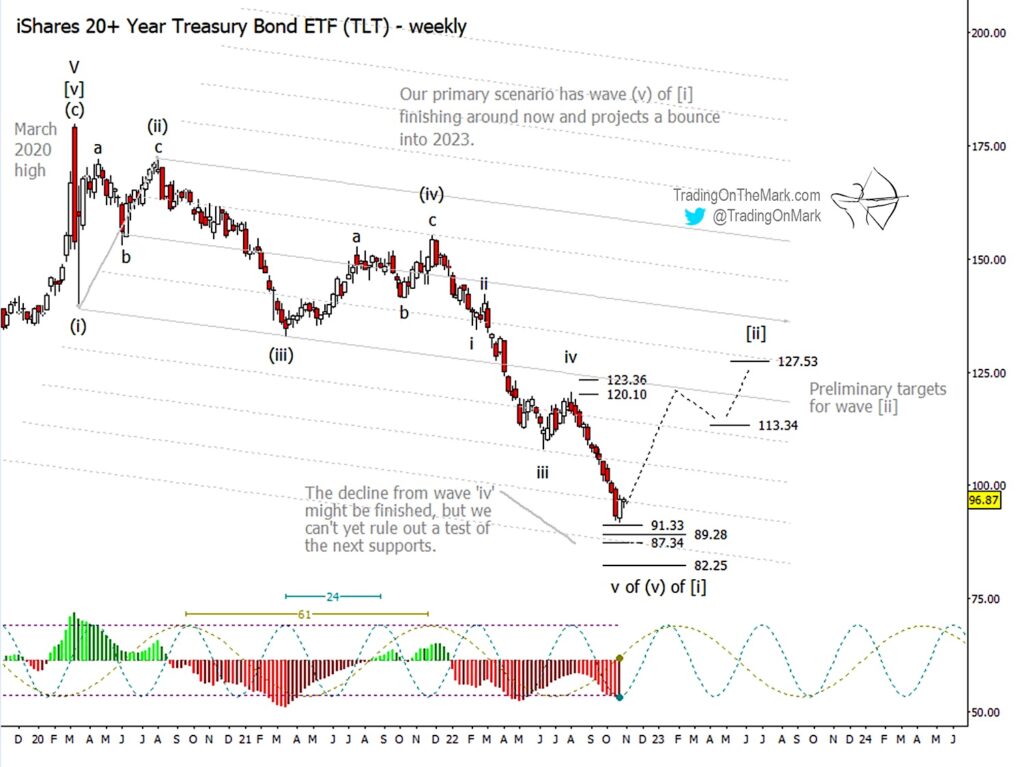
First, let’s revisit the primary scenario that’s a continuation of what we showed last time. We’ve been following what we believe is a motive (five-wave) decline in bonds from the March 2020 high. Note the declining (i)-(ii)-(iii)-(iv)-(v) count on the first weekly chart below.
Within that motive series, our previous post highlighted a shorting opportunity near the resistance zone around 120.10 and 123.36. That move counts well as the fifth and final sub-wave inside the decline from December 2021, and it was a pretty good trade. It actually reached lower than we expected.
Is the decline over for now? We think so, but we can’t yet rule out a further test of Fibonacci-derived supports beneath 91.33, specifically including 89.28, 87.34, and possibly 82.25. In this primary scenario, we would like to see price rise out of that region in the start of a wave [ii] bounce.
Provisionally let’s assume the near-term low is complete and TLT is bouncing. Just keep in mind the bounce isn’t certain to have begun yet, and plan your trading strategy accordingly.
Next, let’s address one of the perpetual bugs/features of Elliott wave charting. Sometimes the correct wave count for a pattern isn’t obvious, or there’s more than one possibility. This can present difficulty for a trader who expects the methodology to provide a clear and unambiguous road map of the market going forward.
However it also comes with some benefits. The prepared trader can watch the market from the perspective of both a primary scenario and alternative one, and thus be ready to step in (or step out) at the first indication of which scenario is prevailing. The trader who sees things that way has an edge over other market participants.
The weekly TLT chart offers an alternative scenario that’s fairly easy to incorporate into a trading strategy, particularly because the implications of the alternative aren’t very different from the implications of the primary scenario in this case.
On the weekly chart below, we’ve highlighted a section from March 2021 through December 2021 that could be counted either as a corrective a-b-c formation as shown above or an impulsive wave ‘c’ as shown below. In the latter case, the implication would be that wave (ii) finished in December 2021 rather than our earlier assignment of August 2020, and that also has ramifications going forward.
The downward i-ii-iii-iv-v count from December 2021 is still impulsive, and we still believe it’s basically complete. The difference is that our alternative calls that section wave (iii), whereas our primary calls it wave (v). In either scenario, a bounce is due and that’s what traders should focus on if it fits with their trading time frame.
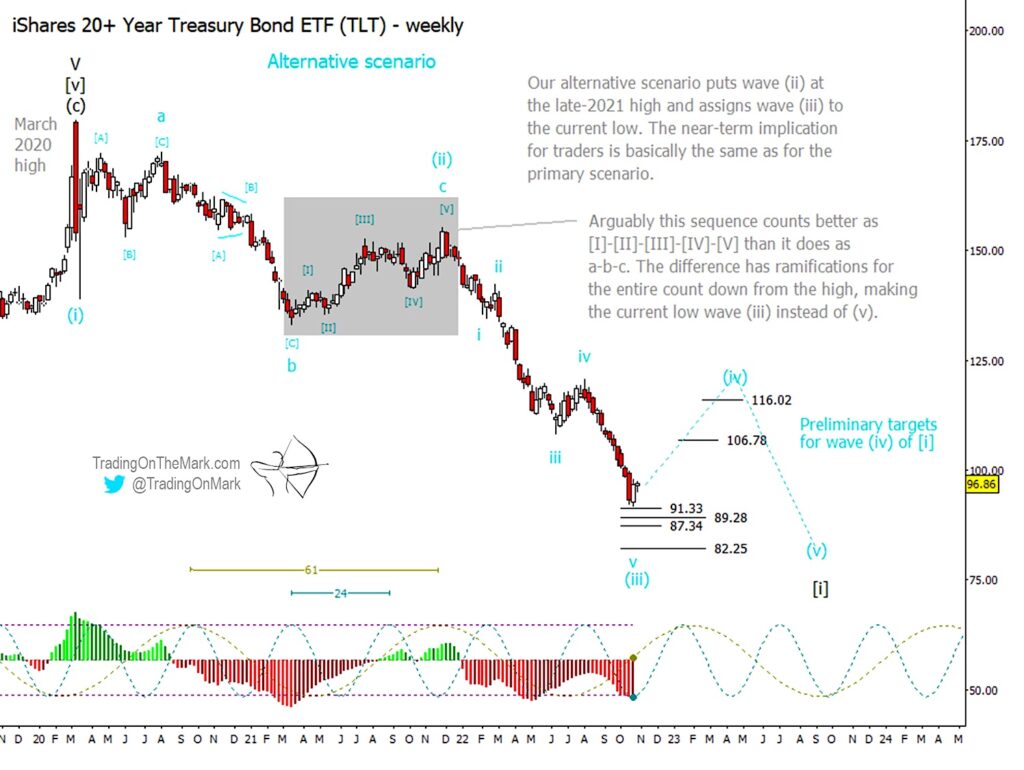
With the alternative scenario, the same caveat applies regarding whether the nearby low is in or not. Price could go slightly lower but it doesn’t have to. But with the alternative scenario we have slightly different targets for an upward wave (iv) retrace, because the move would not fill quite the same role in the market’s development as would the wave [ii] bounce we described earlier. For most traders, this will mainly affect their eventual exit strategy.
The alternative count has some formal advantages over the primary count, and we might end up promoting it to primary. It recognizes that the highlighted section on the chart does look kind of impulsive, as a wave ‘c’ should. It also removes the problematic overlap between waves (i) and (iv) shown in first chart. If the alternative scenario takes the lead, we wouldn’t want to see price go above the wave (i) low from spring 2021.
Price action during the next few months may help us clarify which scenario is unfolding, and we’ll keep you posted!
Let our Elliott wave analysis give you confidence in your trading. Visit Trading On The Mark and follow us on Twitter.
Twitter: @TradingOnMark
The authors may have a position in the mentioned securities at the time of publication. Any opinions expressed herein are solely those of the author, and do not in any way represent the views or opinions of any other person or entity.


