Treasury bond futures appear ready for a sizeable bounce that could persist for several months or longer.
Here we show how the same move might appear in the iShares 20+ Year Treasury Bond ETF (NYSEARCA:TLT).
Although we continue to believe the major high in bonds was set in 2020, the downward pattern since that time might be complete. It is possible to count a five-wave (i)-(ii)-(iii)-(iv)-(v) impulsive move into the TLT support zone near 82.00.
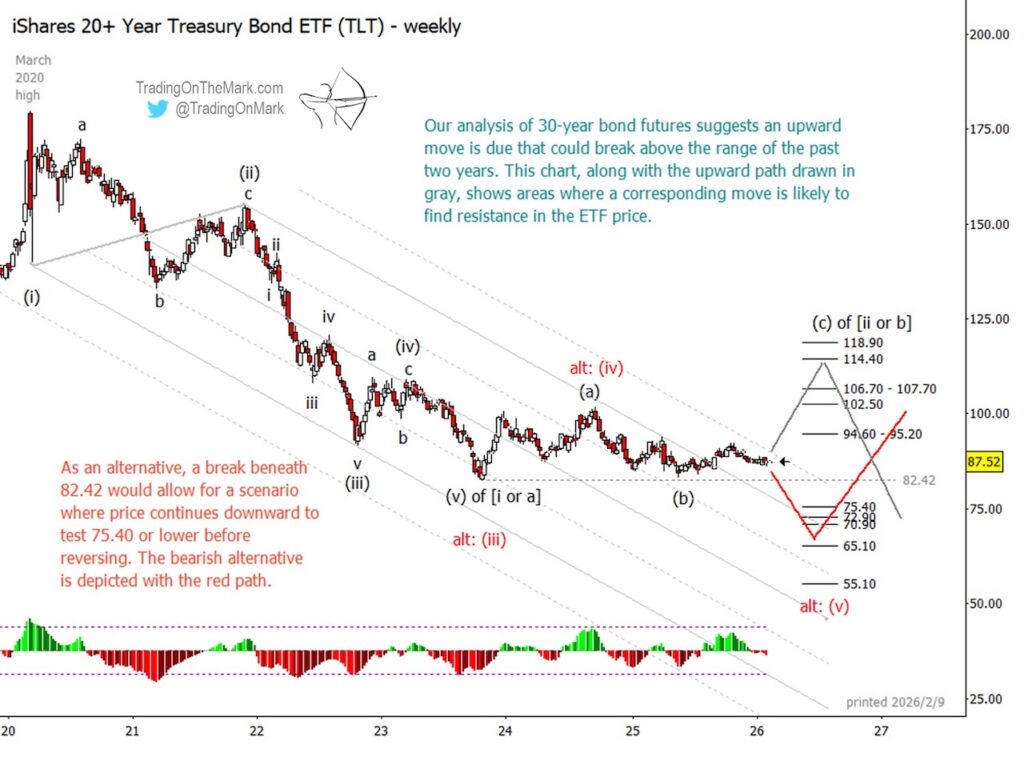
If price remains above the 2023 low of 82.42, then a rally should take it to test initial resistance near 94.60 – 95.20, as drawn with the gray path. Moving above that level would serve as initial confirmation of the bounce scenario and would allow for a test of the higher areas shown: 102.50, 106.70 – 107.70, and our preferred upward target at 114.40. A stretch target for the move awaits near 118.90.
The most prominent alternative scenario is that bonds haven’t yet found a low. As shown with the red path, a break beneath 82.42 would allow for a run to the next support at 75.40 and might allow tests of lower supports.
If price declines, then 65.10 appears the most likely area for the downward move to finish, but even a test of 55.10 would be possible.
You can join us every day at Trading On The Mark for more charts and livestreamed discussions of intraday markets.
Twitter: @TradingOnMark
The authors may have a position in the mentioned securities at the time of publication. Any opinions expressed herein are solely those of the author, and do not in any way represent the views or opinions of any other person or entity.


