The iShares 20+ Year Treasury Bond ETF (TLT) has been a roller coaster ride for bond traders and investors.
As the equity market has been taking the escalator higher, the treasury bond market has been traversing a mountain side since summer.
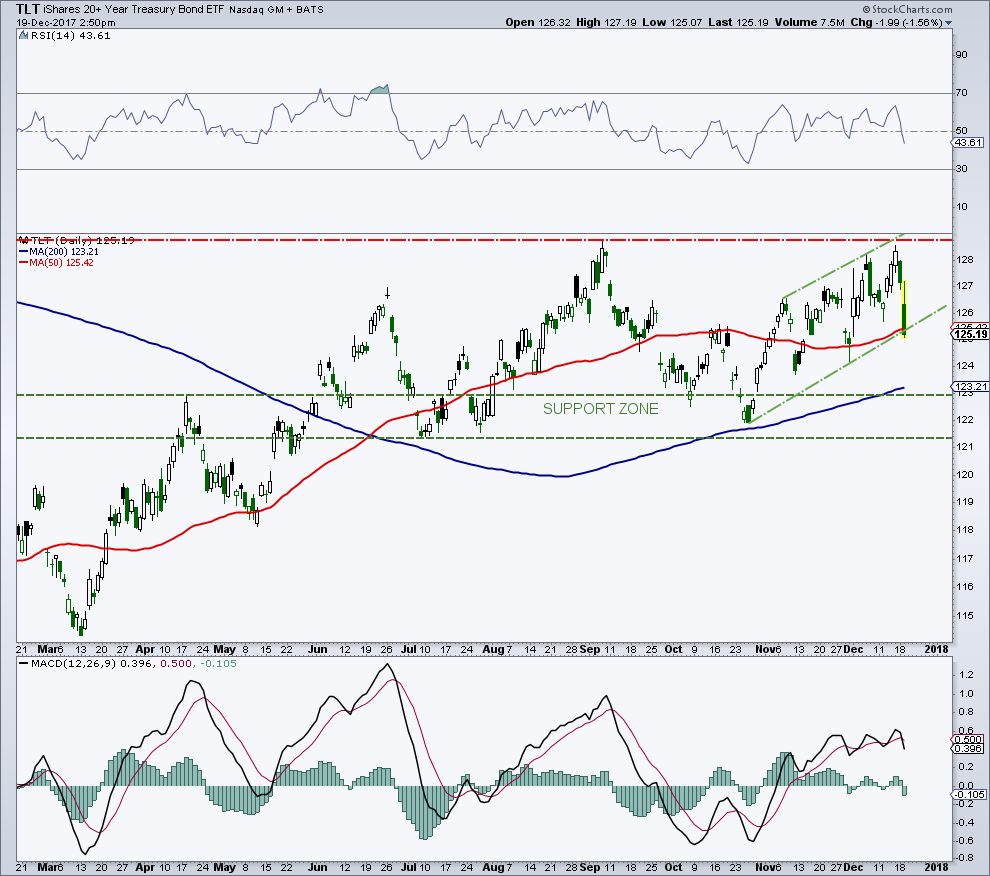
This price action lead many to believe that a top was in the works… and for the past several weeks, many (including myself) were on watch for a right shoulder to form on a bearish head and shoulders pattern.
However, as you can see on the daily chart below TLT has exceeded the highs from June. This makes it less likely that the treasury market is tracing out a head-and-shoulders top. But this week’s decline has been sharp…
So What’s Next For TLT Treasury Bonds?
On the upside, the last piece of chart resistance in the near term is the September high of 128.77, which was tested Friday and rejected thus far. Longer term, a break above this level could see a measured move up to heavy chart resistance in the 132 to 134 price region. On the downside, only a break of the 121/122 region would be concerning. TLT is testing short-term channel support right now.
The COT data (Commitment of Traders) for the 10-year treasury bond is neutral, and somewhat bearish for the 30-year. I am currently flat the treasury market.
$TLT iShares 20+ Year Treasury Bond ETF – Daily Chart
Feel free to reach out to me at arbetermark@gmail.com for inquiries about my newsletter “On The Mark”. Thanks for reading.
Twitter: @MarkArbeter
The author does not have a position in mentioned securities at the time of publication. Any opinions expressed herein are solely those of the author, and do not in any way represent the views or opinions of any other person or entity.


: Showing Some Signs of Emerging Strength")
