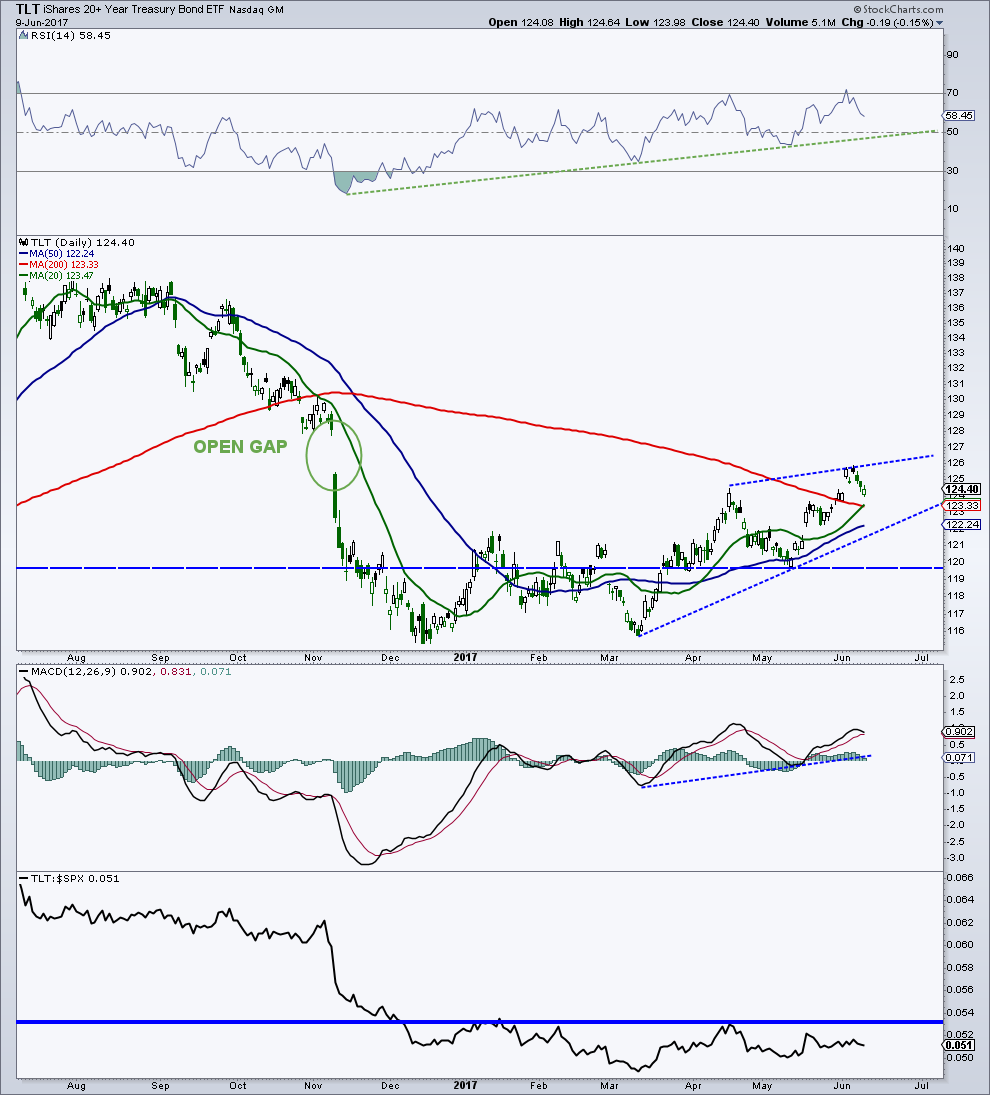
The iShares 20+ year Treasury Bond (NASDAQ:TLT) may be tracing out a bearish wedge formation which is many times an ending pattern.
Let’s look at the chart (below) and discuss some considerations for Treasuries.
So far, price has only been able to fill in the bottom part of the open gap. There is plenty of price support below with the 50-day and 200-day moving averages in the 122/123 region and trendline support down near 122.
The COT data (Commitment of Traders) is firmly bearish with commercial hedgers as bearish on the 10-year as they have been since October 2012, which represented a big topping pattern for the market. Sentiment recently moved to an extreme optimistic condition, another warning sign. I will stay neutral for now, but I certainly am leaning to the bearish side.
$TLT – iShares 20+ year Treasury Bond Chart
Feel free to reach out to me at arbetermark@gmail.com for inquiries about my newsletter “On The Mark”. Thanks for reading.
Twitter: @MarkArbeter
Any opinions expressed herein are solely those of the author, and do not in any way represent the views or opinions of any other person or entity.


