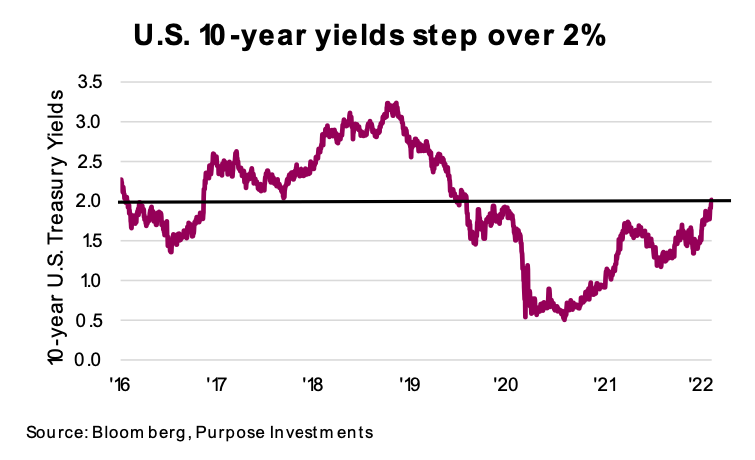
The U.S. 10-year Treasury yield is breaching the 2 percent threshold for the first time since mid-2019. Yes, way back before Covid.
In 2019 yields were falling, the Federal Reserve (Fed) had recently finished a two-year long rate hiking cycle (8x25bp hikes in total) and the U.S. economic leading indicators were flatlining. The economy was slowing and inflation (U.S. core CPI) was a paltry 2.0%. Bond yields kept falling and were then crushed by the pandemic.
Fast forward to today, we have a global economy that is growing at a pace well above norms with global production bottlenecks caused by the strong consumer product demand and issues with supply chains, pushing the Consumer Price Index (CPI) print for January – all helping the 10-year bond yield crest 2.0%.
U.S. CPI rose 0.6% in January, at roughly the same pace of inflation as December and about the average over the past year. Clearly more persistent than passing. There is some good news but mostly bad news in this month’s data. First the good: some of the previous drivers of CPI have started to stabilize or come back down. Plus, much of the rise can still be attributed to durable goods, which continue to experience demand/supply mismatches. However, higher prices are now being seen across most categories. Or in other words, it is spreading.
None of this should be much of a surprise, as demand dynamics remain, and supply is still struggling in certain areas [Omicron didn’t help]. While there are still plenty of dis-inflationists out there, we believe inflation is likely going to remain a hot topic throughout 2022, if not beyond.
It begs a few questions.
What is the path for the demand / supply imbalance?
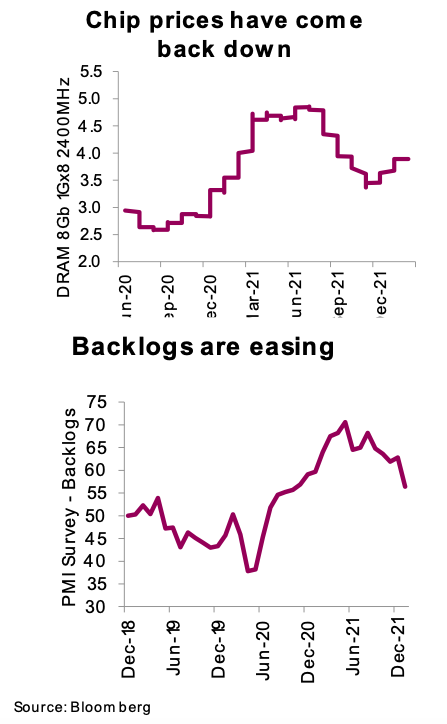
We are optimistic about this one. As we all know, our spending patterns changed abruptly during the past few years and supply chains / logistics are stills struggling to adjust. Add in some Covid issues, and delivery now takes even longer. But if you look a bit further up the supply chain, things have been improving. There are still shortages in chips, but price action indicates things are improving. Manufacturing survey data does support that backlogs are easing. Just ask a friend who has purchased a new car or couch; it may have been delayed but has likely arrived.
This is evidence the supply chain is catching up. And, assuming the broader re-opening continues to gain traction, the shift from durable goods to service spending that has already started may well accelerate. If this happens, we could very well be talking about too many goods in a year or two.
Are inflationary mindsets changing?
Inflation is psychological. Higher prices are manageable from an overall market / economic perspective if buyers and sellers view them as temporary. They become an issue when people start believing the pace of price increases will continue for a much longer period. Do I buy today or wait? If I wait, it will be more expensive? Do I demand a higher wage based solely on the rising cost of living? This mindset changes behaviors and that can be economically dangerous.
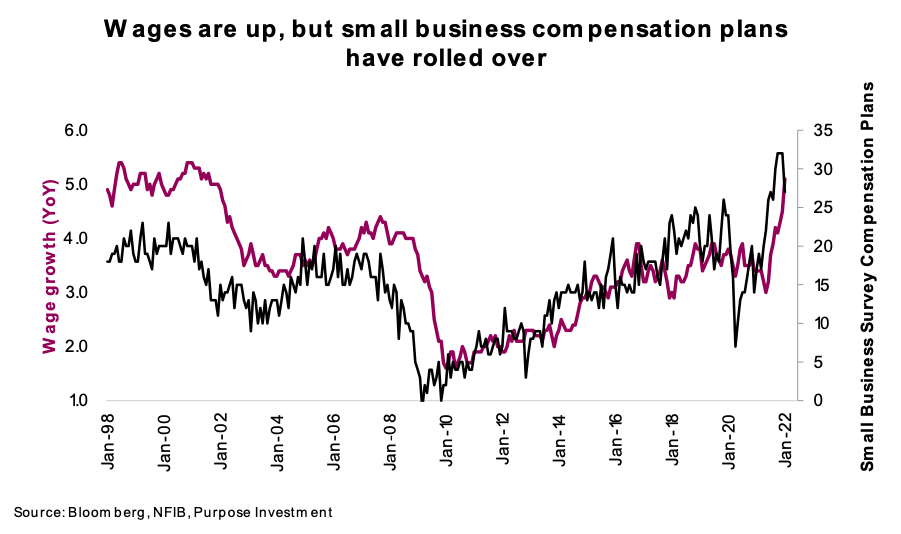
Wages have started to rise. It is still difficult to conclude if this is a mindset shift or yet another demand / supply imbalance caused by the pandemic. Labor participation rates plunged, after
all. The economy is expanding, companies are trying to meet rising demand, profits are up, productivity is up, companies appear willing to pay up. The chart below shows U.S. wage
growth running at about 5%, the highest since the late 1990s-early 2000s. Labor is in the driver’s seat at the moment. However, the NFIB small business survey on compensation plans, which has a history of leading wage changes, may have peaked and rolled over. We will watch closely.
What are companies thinking? Scrubbing earnings calls, research, presentations, company filings for TSX and S&P 500 member companies and looking for key words or synonyms, we see what is on their minds. For a baseline, we used the average frequency of key words in 2019. Companies are clearly struggling with ‘cost inflation’ which fell during the depths of the pandemic in 2020 and has been steadily rising (see chart below). Labor costs have been rising as well. Most interesting has been mention of margin pressure, a recent increase. Higher costs certainly hurt margins, but a stronger economy and rising prices help margins. Companies are mentioning margin pressure but mention of lower margins has not followed. The coming quarters will be crucial if this ‘talk’ translates into actual margin issues.
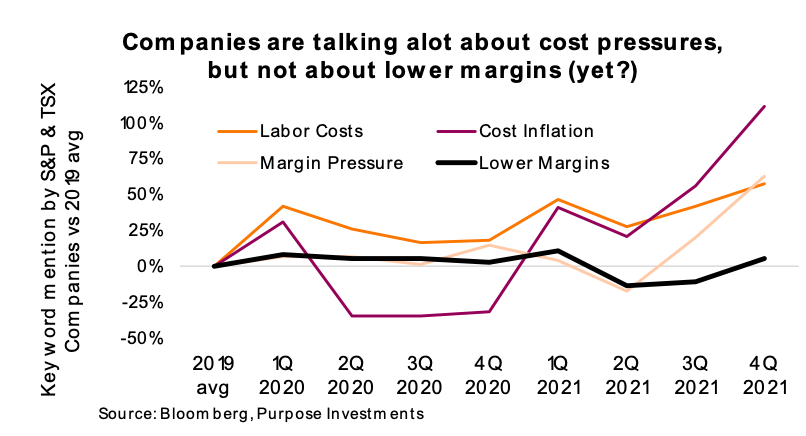
Broadly speaking, it is safe to say higher costs and now margin pressures are on the minds of corporations.
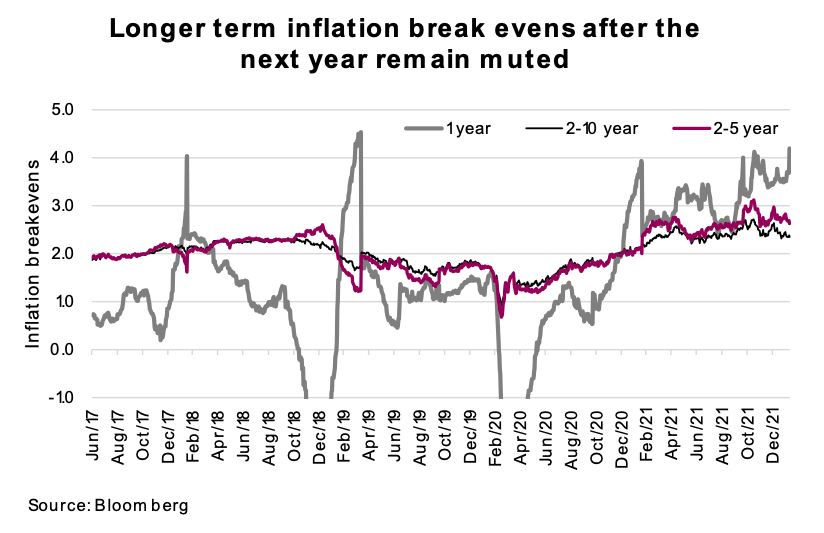
Will break-evens move?
We can all cite anecdotes of having to pay more for something that used to cost less. But the bond market continues to say this will pass. Perhaps it’s because of the mountain of debt accumulated during this pandemic (which is long-term disinflationary), or demographics, or technology. Or it is a learned response developed during careers spent in a low inflationary world. Any previous upticks faded. There are now almost two generations of investors that have never seen any real inflation.
In the 1980s, bond traders didn’t believe the central banks could tame inflation. Even into the 1990s we were hearing “rates have only one place to go, up!”. Any rise in the inflation data was expected to continue to rise and potentially spiral. Thirty years later, these aggregate beliefs have reversed. We learn from our personal experiences or history and form pretty strong beliefs. Perhaps we are all more Pavlovian than we think.
At the moment, the market is saying this will pass. Inflation break-evens past the next year have actually been coming down over the past few months. The path of these longer-term break-evens matter much more for markets than does the one year or CPI data.
Investment Implications
We remain in our previous camp – bond yields will trend higher but we may have already experienced most of the move (especially after the 3-sigma move this week!). Base effects will take the CPI headline data down materially this year, reducing the quantity of ‘inflation talk’, but inflation will remain elevated compared to the past decade. While this is our base case, the variability of scenarios is much greater today than in years past. Or in other words, inflation risk is now with us.
We continue to believe tilting towards value will perform better than growth in this elevated inflationary world. Real assets or other investments that can hold onto purchasing power should remain a portfolio construction consideration. We would also point out that given Canada’s TSX Index’s exposure to resources, infrastructure and real estate, it is one of the more ‘real’ markets available to investors.
Source: Charts are sourced to Bloomberg L.P., Purpose Investments Inc., and Richardson Wealth unless otherwise noted.
Twitter: @ConnectedWealth
Any opinions expressed herein are solely those of the authors, and do not in any way represent the views or opinions of any other person or entity.
 Rolling Over At Key Fibonacci Level?")


 Rolling Over At Key Fibonacci Level?")


