As the stock market methodically moves higher and higher to its next milestone, the 10-year treasury yield is about to break out to its highest level since 2011 while the 30-year treasury yield is close to its highest level since 2014.
While the financial community was aghast over trade wars, omens, and a continuous chorus of crash calls, a 3%+ 10-year seems to have been lost in the shuffle.
Back in January, it was going to be the end of the bull market. And now, Just Dust in the Wind (Kansas).
How can this be? The great bull market and the U.S. economy would be thrashed by higher interest rates and by a 3% 10-year. Well, like all market fears, once they are proved wrong, the perma bears move on to their next great worry. So how high might interest rates go in the next year and will they eventually bring down the market and the economy? To the tape we will go!
10 Year Treasury Yield – Daily Chart
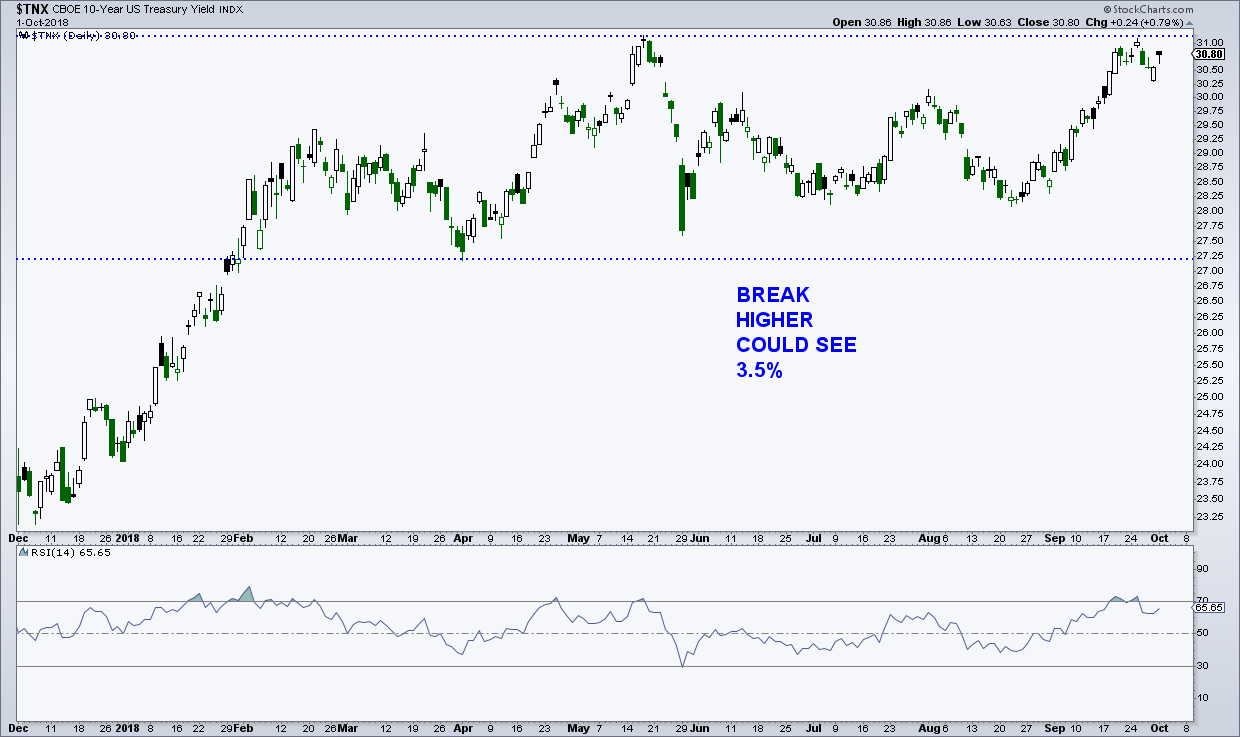
The daily chart of the 10-year yield shows a sideways consolidation back to February between 2.72% and 3.12%. With the current yield at 3.07%, we are very close to the top of the 7+-month range. A break through chart support at 3.12% would open the door for a measured move to the 3.5%. I call this support (I might be the only one) for two reasons: This is where prior buying came in and yield is derived from price. In other words, inverting the yield chart would give us a price chart, which would show price testing the lower range of the consolidation.
10 Year Treasury Yield – Weekly Chart
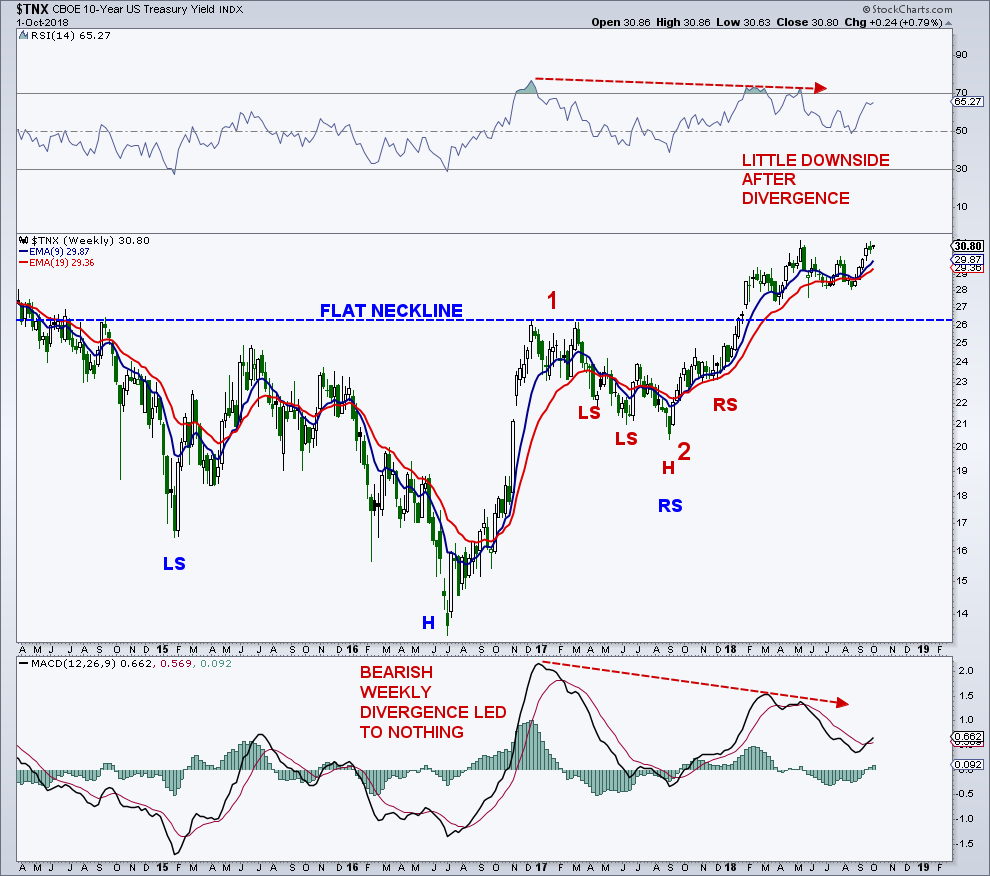
On the weekly chart, the 10-year completed an inverse head-and-shoulders pattern back in January and based on the size of the formation, we could see a measured move up towards the 4% region. While it’s hard enough sometimes to get the direction and magnitude correct, timing a move such as this is even more difficult. We will just say 3.5% this year, 4% sometime in 2019.
From an Elliott Wave perspective, it appears that Wave 1 occurred during the second half of 2016, Wave 2 then lasted until September 2017, and we are currently in Wave 3.
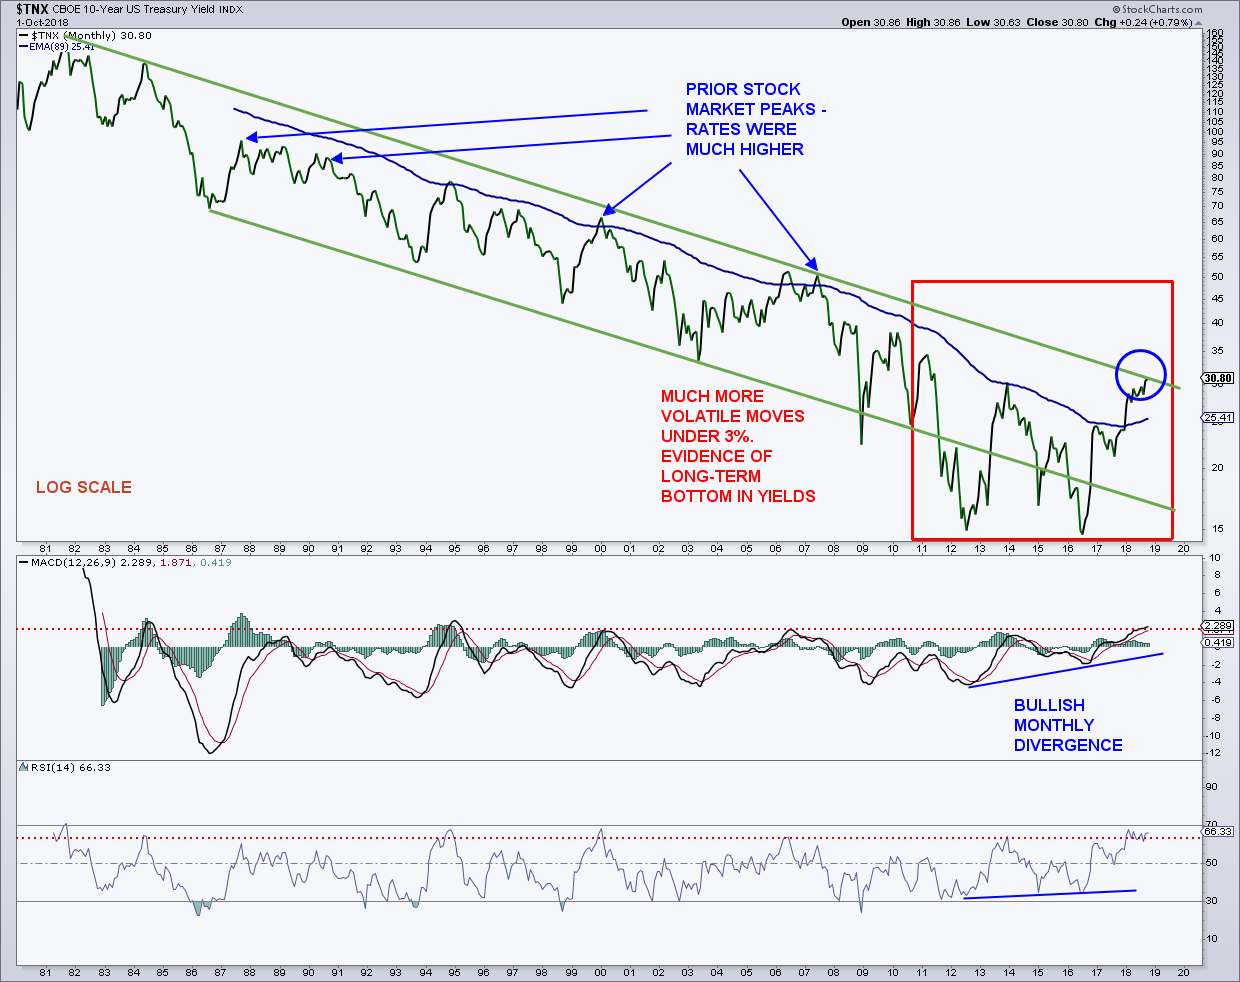
10 Year Treasury Yield – Monthly Chart
Before I further discuss the current long-term technical condition of the treasury market, I will repeat (and highlight) a couple of conclusions from months ago.
First, the peaks in the stock market in 1987, 1990, 2000, and 2007 occurred when the 10-year yield was at 9.6%, 9%, 6.8%, and 5.3% respectively. With the current yield on the 10-year at 3.06%, we most likely have a fair amount of leeway on the upside before any stock market or economic issues develop.
Second, and this comes from a lot of historical data, the stock market’s highest valuations have occurred with the 10-year yield between 4% and 6%. This also supports the belief that any bond market worries for stocks are most likely very overblown.
The monthly 10-year yield ($TNX) chart shows that yields have reached the top of the downward sloping channel that goes back to the early ‘80’s when using a log scale. I have been saying for years that the 10-year yield is in a bottoming process that would take many years. A 30+-year bull market does not turn on a dime. We have seen a large pickup in volatility since 2011, and this is strong evidence that a trend change is taking place.
Yields have blown through the 89-month exponential moving average for the first time in decades, and that average has turned higher, which also hasn’t been seen in decades. To break the long-term (L.T.) channel, yields probably need a strong push over 3.2% to end the very long bull market in bonds. Yields have already completed a very large double bottom on the monthly chart and this targets the 4.5%+ area in the next year or two. The monthly MACD is in positive territory while the 14-month RSI is at its highest level since 2000. These two L.T. momentum indicators are suggestive of higher yields in the year(s) ahead.
There are some very bearish (some of which were already talked about) as well as bullish things about the treasury market, which must be addressed. Earlier this year, there were major bearish divergences on the weekly chart, meaning that we could see a big decline in yields. That did not happen as yields corrected sideways. This could be very bearish for the bond market and much higher yields.
On the bullish side, commercials hedgers (so called smart money) have a huge position in the 10-year while large speculators have a huge short position in the 10-year. Sentiment toward both the 10-year and 30-year is very bearish, which in the past has led to good returns for bonds. One note here: the COT report, as well as sentiment, has shown the same setup for much of this year and until bond prices reverse higher, it’s just secondary information.
There was an old but interesting comment I saw recently about bond yields that went like this: The bulls will say lower rates make stocks more valuable and higher rates means the economy is improving, which is also good for stocks. Despite what appears to be flawed logic, it does make sense depending on where rates stand.
Another interesting observation: The yield curve (10s – 2s) has fallen about 270 basis points since its 2011 peak. The yield curve fell about 296 basis points during the last decline from 2003 to 2006 and nearly another 300 basis points from 1992 to 2000. This “might,” suggest (only a couple of observations) that we are getting long in the tooth for the current curve decline and that long rates could start to move higher faster than short rates. It could also mean that short rates start to back off after a fairly dramatic run, or it could just be an interesting observation!
Feel free to reach out to me at arbetermark@gmail.com for inquiries about my newsletter “On The Mark”. Thanks for reading.
Twitter: @MarkArbeter
The author has a long position in Platinum at the time of publication. Any opinions expressed herein are solely those of the author, and do not in any way represent the views or opinions of any other person or entity.


