The major stock market indices continued to gain ground on Friday, with the S&P 500 Index (INDEXSP:.INX) stretching higher by nearly 0.50%. Transportation stocks and small cap stocks are showing outperformance.
That said, to some extent Friday was led more by defensive groups like Utilities and Telecomm. They showed the most outperformance while Energy and Industrials were down.
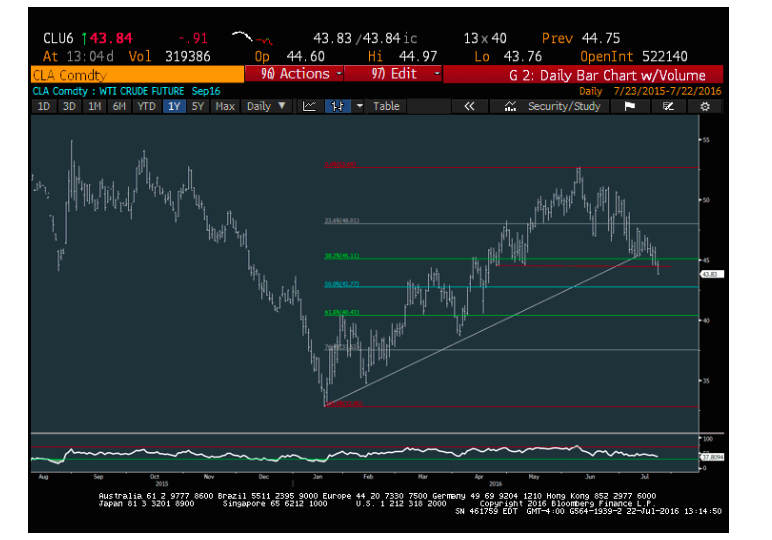
Looking at commodities, WTI Crude Oil has turned back lower and broken down UNDER the May Lows. Energy is also breaking down relatively vs the S&P 500 Index when looking at Oil Services (OIH) vs S&P 500 charts. This suggests even further Energy Underperformance and OIH should lead to the downside in this regard. See Crude Oil trading chart & analysis below.
For longs, Utilities have shown evidence of turning back up in the near-term and this sector along with Healthcare can be overweighted into early next week for outperformance.
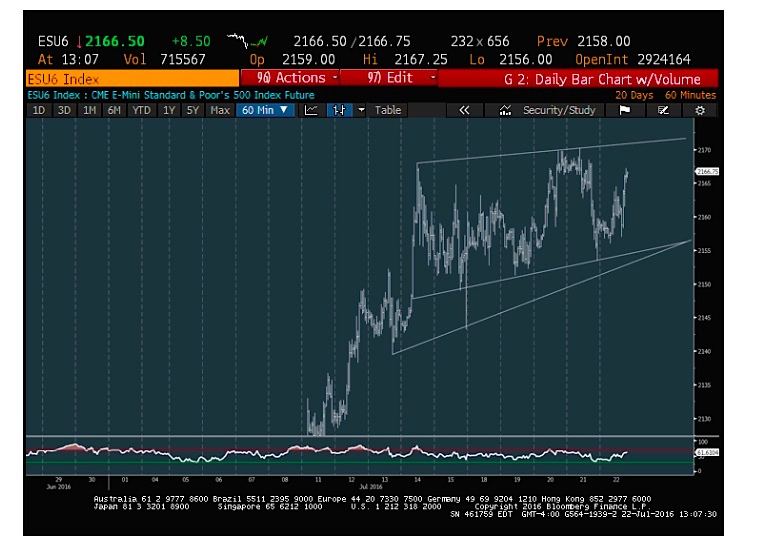
Bottom line, while sector rotation is starting to take on a more defensive bent, and Treasuries have shown some evidence of turning back higher, an actual move lower in equities is still a bit early to bet on. The recent consolidation type “triangle” on the S&P 500 trading chart (see below) looks likely to lead one final push to new highs up to around the 2180-2185 area (2185-2190 for SPX cash).
S&P 500 Trading Chart (Futures) & Analysis
This leg of the stock market rally should be close to reaching its conclusion. But for now, it still looks likely to test the upside of this consolidation as high as 2183 in S&P 500 futures.
For now, no evidence of this turning down in a fashion that would warrant playing for the downside.
Crude Oil Trading Chart & Analysis
Crude finally showing some evidence of breaking down under May lows & larger uptrend, and the Energy sector is showing a similar breakdown. This was already the worst performing sector this past month, but should continue underperforming.
For more on my premium subscription service, please visit Newton Advisor. Have a nice weekend.
Twitter: @MarkNewtonCMT
The author may have a position in mentioned securities at the time of publication. Any opinions expressed herein are solely those of the author, and do not in any way represent the views or opinions of any other person or entity.


