Trading the Triangle Breakout
The market is full of shapes like rectangles, wedges, and triangles. The triangle breakout is found heavily across all markets and can be traded rather simply.
What’s actually happening? Well, when the markets are making lower highs, at the same time making higher lows, we are converging tighter and tighter towards an apex. Think of it as the markets being compressed, building up steam if you will.
At the apex, the market has to release that pressure. We often see triangle patterns resume in the direction of the prior trend.
Let’s look at this most recent trade on the E-mini S&P 500. Looking at a daily chart (below, left), we have a nice triangle forming, tightening to an apex and spiking to new highs.
S&P 500 Futures (E-mini)
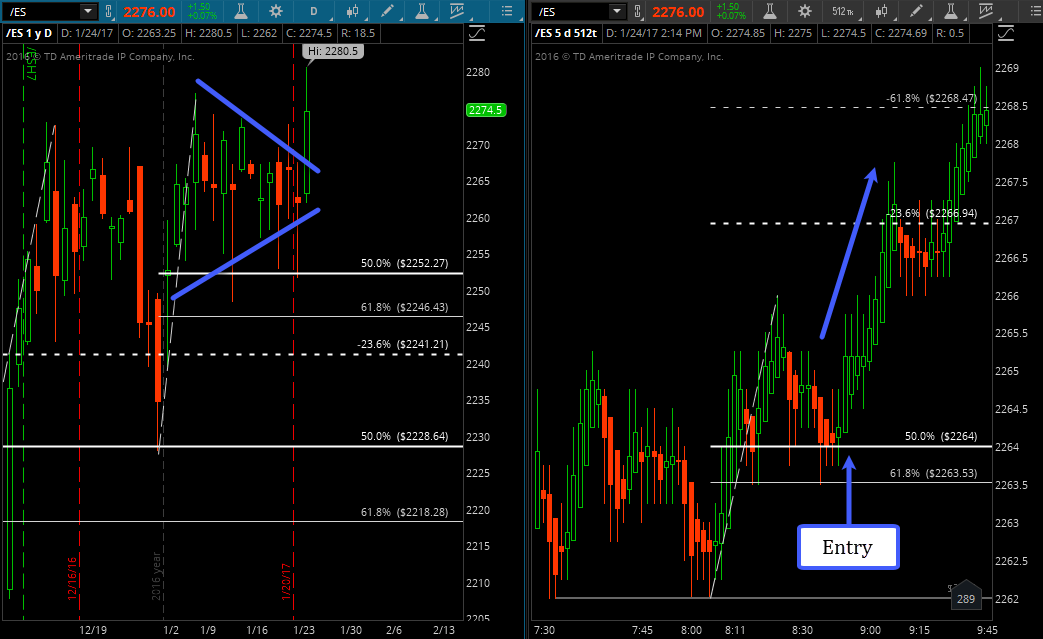
The trade setup occurs on the 512 tick chart. After a quite morning of 60 mins of intraday trading, the market broke the mornings highs, but a few ticks. At this point we can draw a Fibonacci retracement, allow the market to come back to the 50% and enter for a long. This proved to be the trade of the day, taking us to new highs.
This same concept can be used across many different time frames and markets. Check out more of my work over at EminiMind. Thanks for reading.
Twitter: @EminiMind
Any opinions expressed herein are solely those of the author, and do not in any way represent the views or opinions of any other person or entity.

: Showing Some Signs of Emerging Strength")
