A trend is nothing more than the general direction of something, be it a fashion trend, a product sales trend, or an employment trend. Trends are time based and can catch momentum. When they do so, a clothing style makes headlines, a product’s sales take off, and employment noticeably increases.
And once the momentum takes off the fashion trend can last for weeks to months to years, same for sales and employment. Trends can, and will, change direction, either in the short or long term as previous fads go out of style, once products lose their luster, and employment decreases. And this goes for trading as well.
For traders, the trend is the general direction of the instrument traded, be it stocks, commodities, bonds, etc. Traders trade trends on various time frames from intra-day to daily to weekly charts. No matter the time frame, when a trader goes long an instrument he wants it to trend higher; when he goes short, he wants it to trend lower. Therefore, all traders are trend traders but not all traders trade the same trends because each trader trades various instruments on different time frames or a combination thereof. (Note: trends are subjective with trading. They reside in the eye of the chart trader).
I trade trends using a combination of weekly and daily charts. I use the weekly chart for direction and the daily chart to take action in the weekly direction. When prices break specific levels momentum can develop to either continue the current trend or even reverse its direction. No matter how we choose to describe it, the underlying principle of trend trading is that it is time based, direction specific and momentum driven.
Let’s take a look at two recent examples and a few potential ones in the current world of trend trading.
RECENT TREND CONTINUATION TRADE
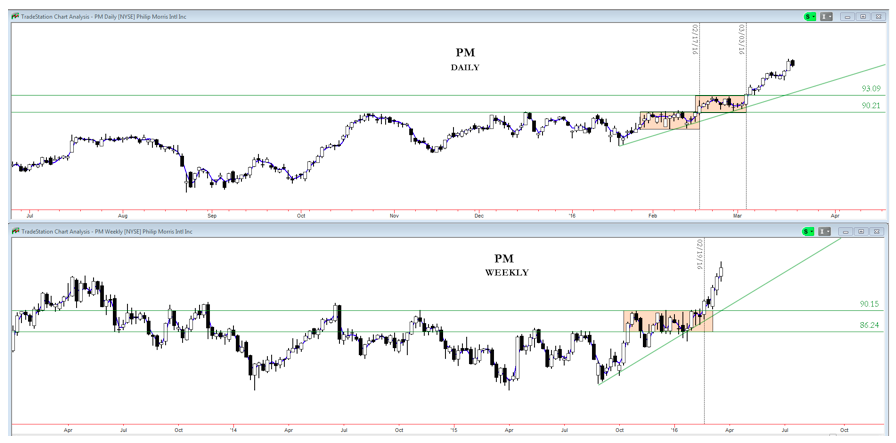
Philip Morris International (PM)
PM broke out of its weekly box along a rising trend the week ending 2/19. That same week, on 2/17, the price broke free from its daily box, thus confirming the weekly trend. It wasn’t until 3/3 that PM caught additional momentum by breaking a new box, thus providing additional confirmation of both the weekly and daily trend.
PM Weekly And Daily Charts
RECENT TREND REVERSAL TRADE
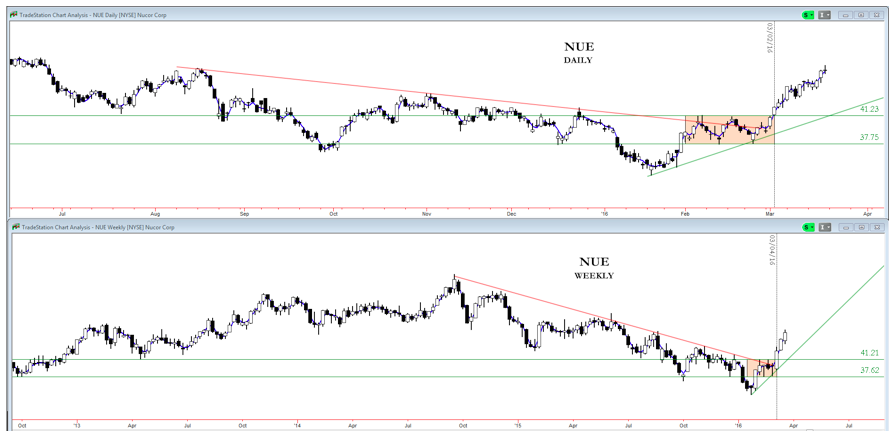
Nucor (NUE)
NUE broke its weekly downtrend the week ending 3/4 after chopping sideways for the better part of a month. The daily didn’t waste much time confirming the weekly trend line break as it developed and broke its own box above the weekly downtrend line the same week, while printing a higher low for a newly established trend.
NUE Weekly And Daily Charts
POTENTIAL TREND CONTINUATION TRADES
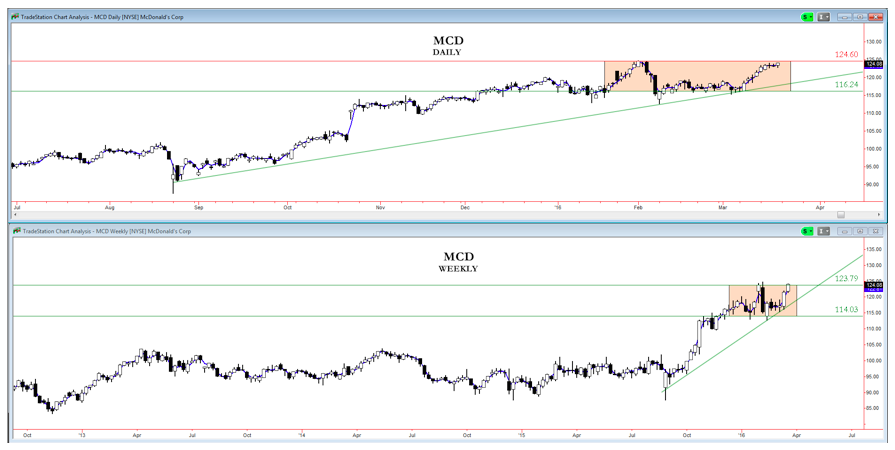
McDonald’s Corporation (MCD)
MCD is at new highs thanks in some part to the new all day breakfast menu. The price is sitting right below a potential break of its daily box to confirm the weekly break and trend continuation.
MCD Weekly And Daily Charts
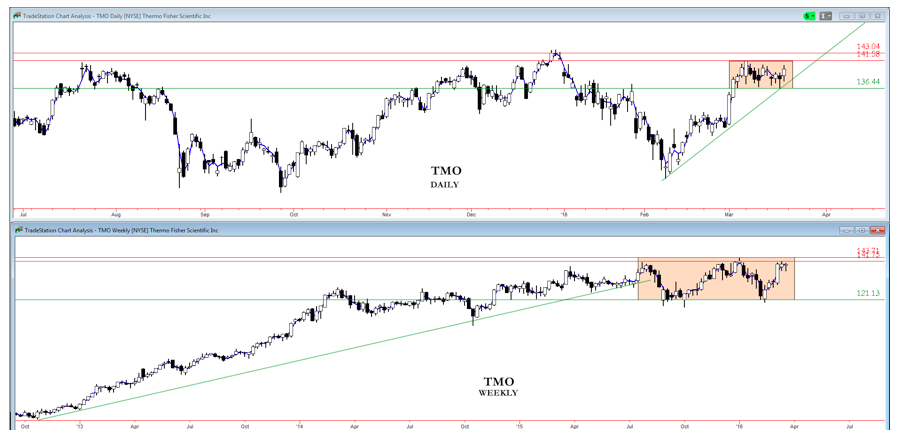
Thermo Fisher Scientific (TMO)
TMO is trading right below its all time highs after consolidating on the weekly chart since last summer. It has formed a daily chart box ready for a potential break higher along its uptrend. If the daily breaks, a trend continuation is in order for both the daily and weekly time frames.
TMO Weekly And Daily Charts
continue reading on the next page…

: Showing Some Signs of Emerging Strength")
