Identifying trading trends: When Moving Average Collide…
One of the simplest ways to assess the trading trend (or lack thereof) in an ETF or index is to review the relative position of the moving averages.
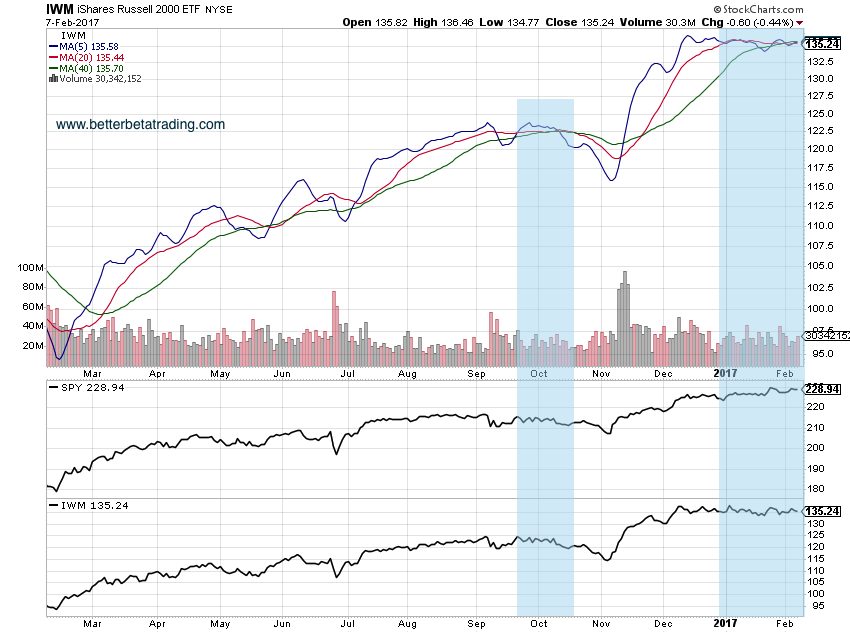
A quick glance at the small caps Russell 2000 ETF (NYSEARCA:IWM) shows a 5, 20 and 40 simple moving average stacked on top of each other.
And this congestion (highlighted in blue), perhaps the worst of the major equity indexes, has an impact on other equity indexes like the SPY ETF. Given the consistently high 30 day correlation between the two ETFs (currently 0.82), a tight trading range in the small caps reduces the likelihood that the large caps will take off.
IWM Moving Averages Chart vs Actual ETF Performance
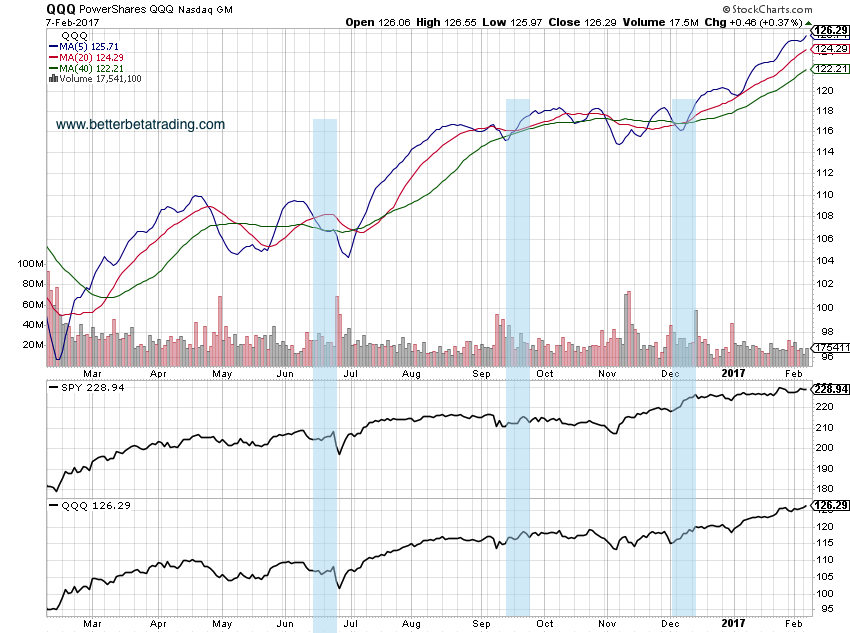
Looking at the Nasdaq ETF QQQ (NASDAQ:QQQ), we see a similar relationship. Past periods of congestion for QQQ have coincided with range-bound price action in the S&P 500 ETF (30 day correlation between SPY and QQQ is currently 0.78). Although QQQ is demonstrating a much healthier upward trend than IWM, SPY’s resulting movement has lagged QQQ’s move, starting with the early December moving average crossover.
For those traders who are looking to identify broader price trends, turning off the daily candles or bars and focusing on a set of moving averages can reduce the noise. And with correlations between equity index ETFs typically above 0.75, trade success can improve when their respective trends are aligned.
Thanks for reading!
Any opinions expressed herein are solely those of the author, and do not in any way represent the views or opinions of any other person or entity.


 Testing Important Price Support")
")
