After a big rally to end last week, traders are anxious to see how stocks will hold up. And after such a sharp, quick decline in the stock market to begin the year, it’s hard not to think about the possibility of a bear market rally.
If this quick burst higher is a bear market rally, then it’s imperative that we stay disciplined while executing trades and looking for trading ideas.
We need to stay true to our process for finding quality trading setups – something that can be hard to do after a sharp 3 day rally. How stocks handle the first pullback will be key. If buyers come in, then we’ll see even more trading ideas and setups emerge.
Below I have put together 4 trading ideas that are on my radar for the week of January 25. These four stocks have trading setups that look interesting and may bear fruit for disciplined traders. I’m waiting for the “triggers”.
4 Stocks To Watch
Cree Inc. $CREE
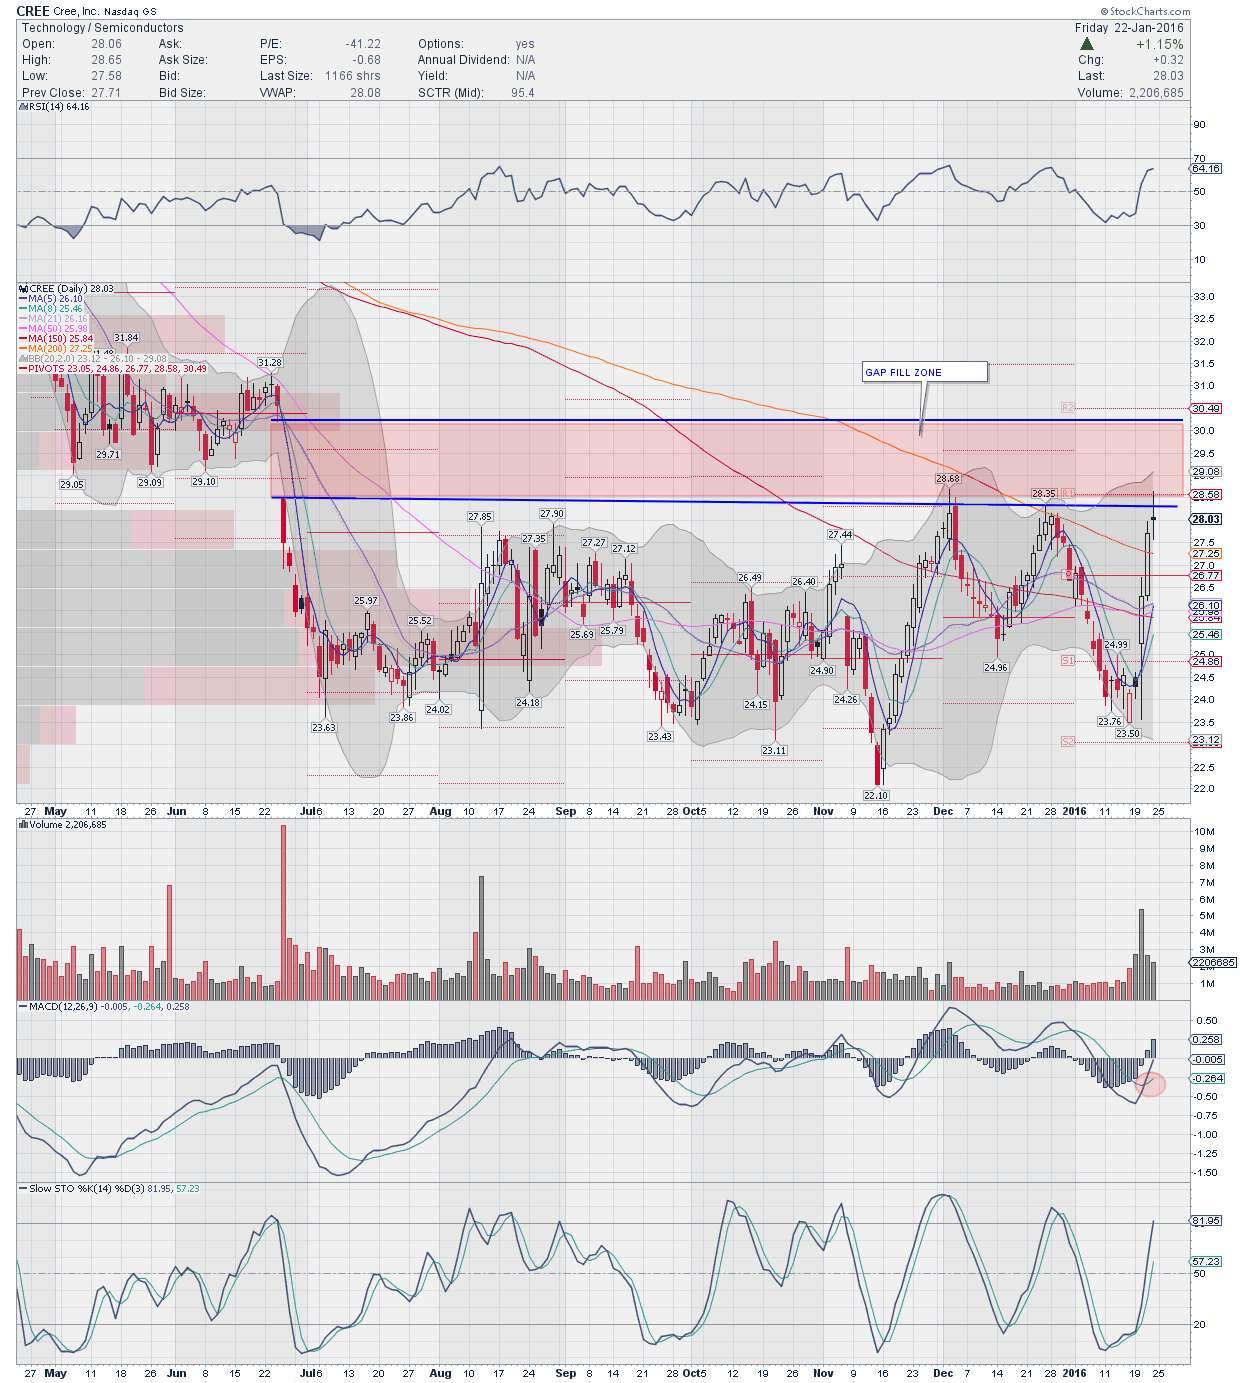
CREE formed a double top in October 2013 and started falling lower.Ever since that event, it slowly moved lower and well below its 200 SMA which is a bearish sign. CREE has formed a big base consolidating since June 2015. The base ranges about $6 between 21.75 and 28.
The move lower created a decent sized gap and at least on 2 occasions, CREE has tried to move higher but in vain. But this past week, the stock spiked higher on heavier volume and has closed over 200 SMA in a very long time. This is positive sign. Ideally I would wait for a pullback for a quick retest of the 200 SMA and then move higher to fill the gap which closes around 30.20 to start with but there are other gaps to fill higher too. Since the base measures around $6, I would look for a move towards 34-35 in due course, well above the first gap fill zone.
The Relative Strength Index (RSI) is bullish while MACD has crossed up and rising. Cree Inc. (CREE) doesn’t report earnings April 19th.
Starbucks Corp. ($SBUX)
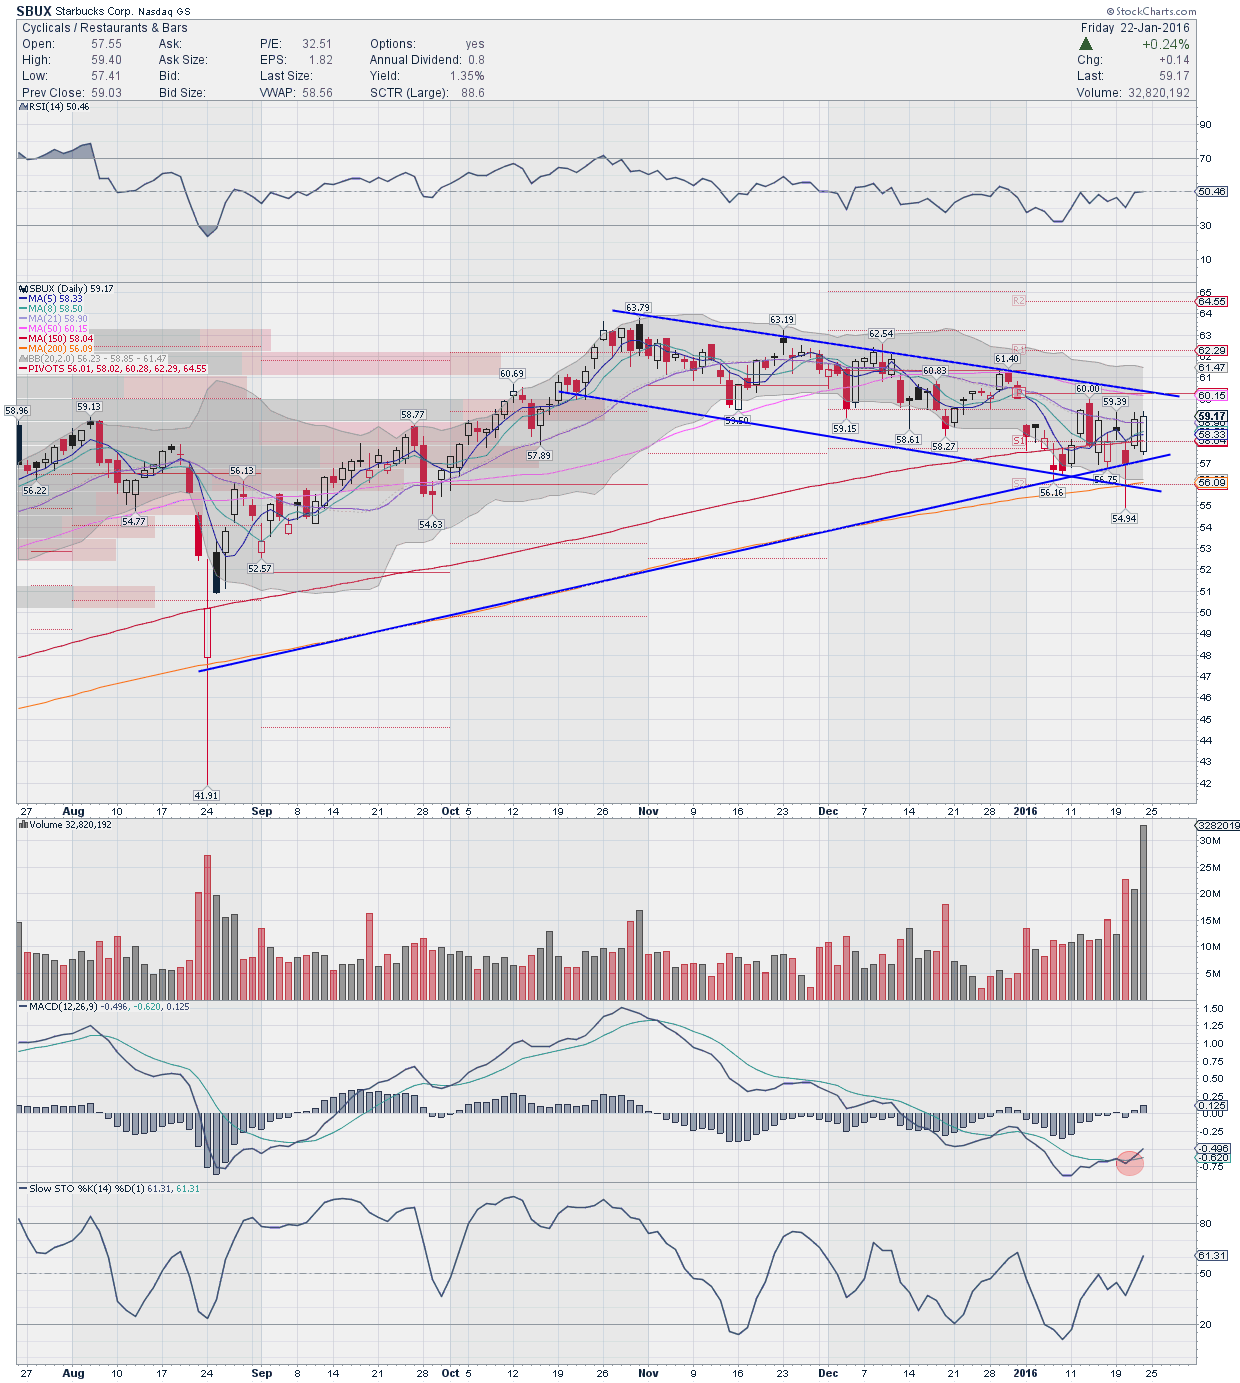
SBUX has formed 2 formations – one is a descending channel and the other is the symmetrical triangle ascending slightly. Starbucks stock price sold off on the 22nd of January after their earnings were released but recovered nicely. While I want to lean towards the bullish side, I want to be clear that the triangle formation can break either way. So better to wait for the break higher or lower and then enter if you do not have a position already.
If Starbucks (SBUX) can break above 60.15, its first resistance zone, then I would look for at least a $3-4 move towards 63.79 or even the next resistance at 64.55. MACD has just made a bullish cross and RSI is right at median. Starbucks has already reported its earnings results this quarter and hence, we don’t have to worry about it for now from an earnings report standpoint.
Clorox Co. ($CLX):
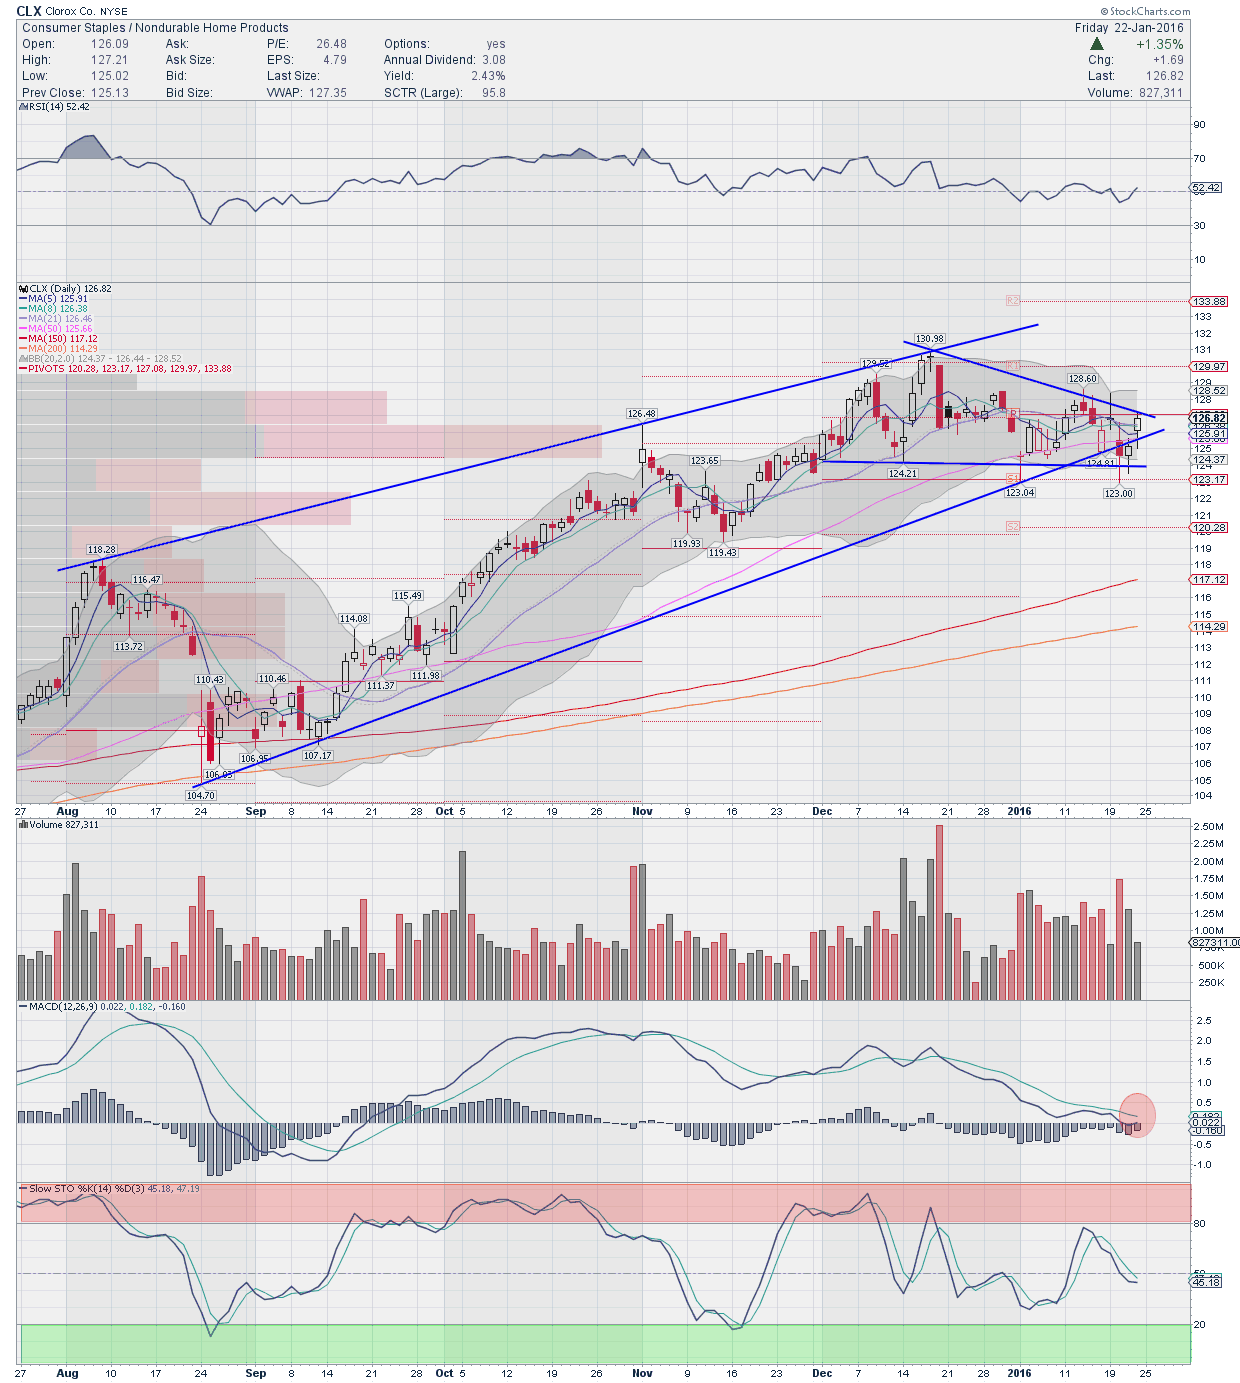
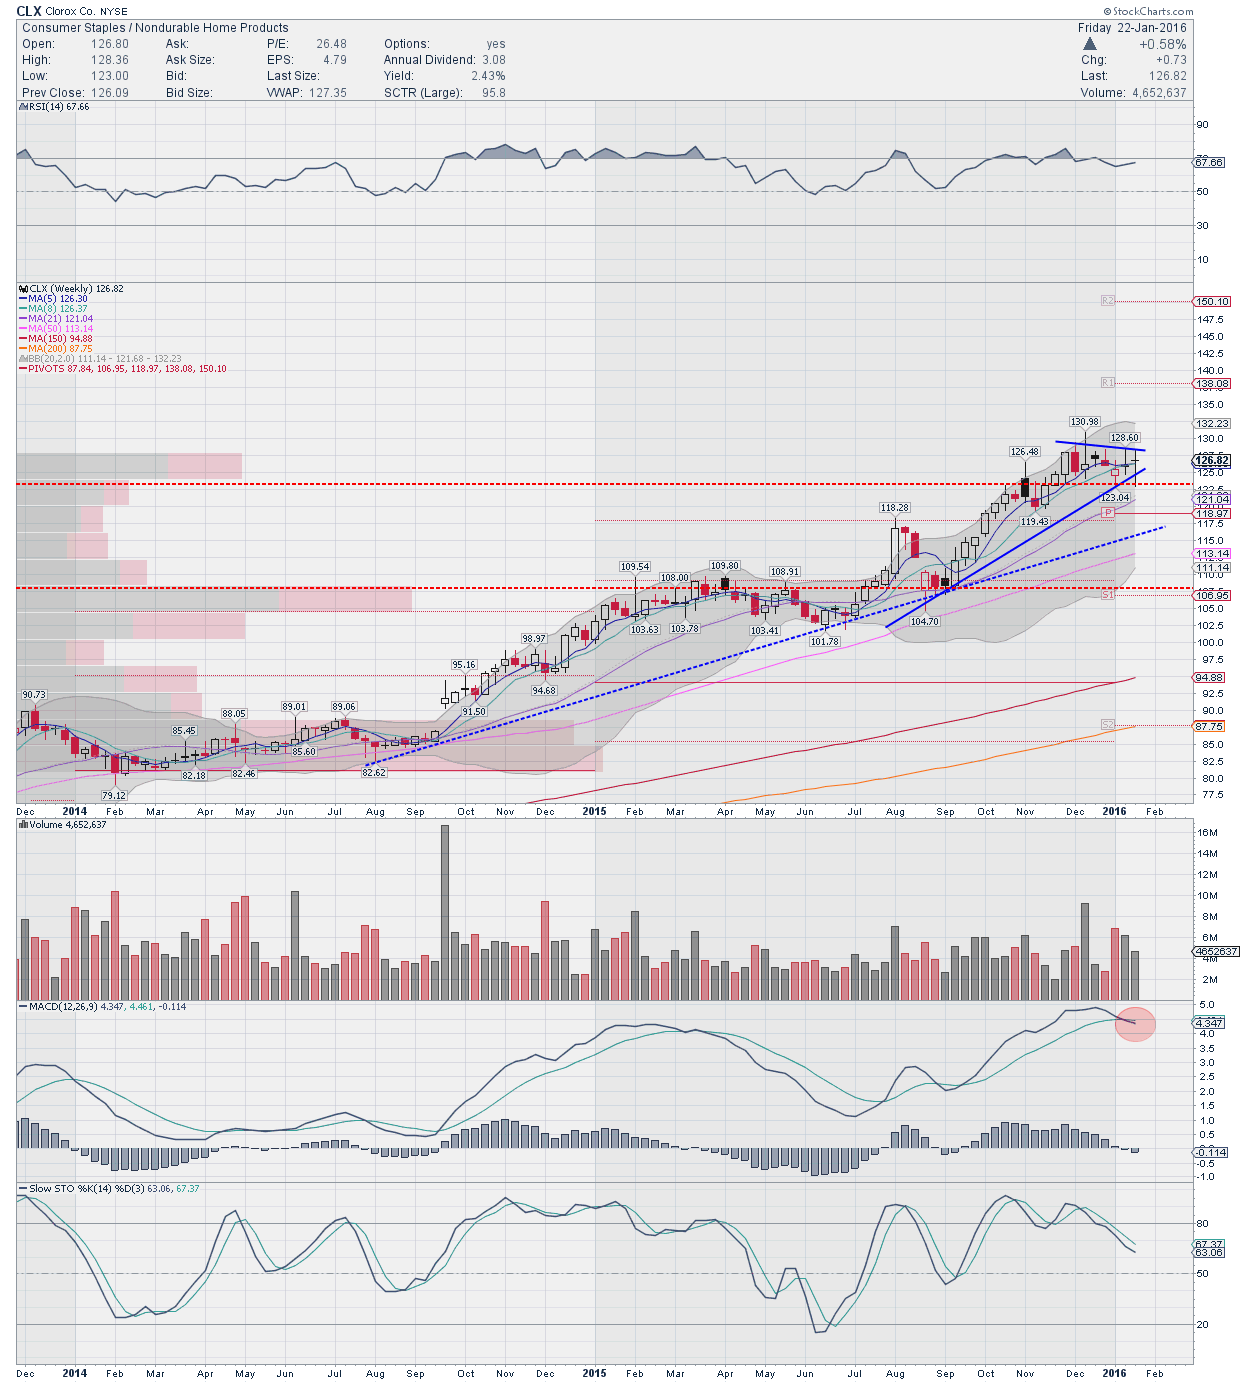
CLX is one of the stronger names that has shown relative strength during the downtrend. Clorox stock price has been consolidating near all-time highs with a rising 200 SMA. RSI is just above median and MACD is trying to turn up for a bullish cross. On a weekly timeframe, CLX has formed a bull flag and is riding above the 50 SMA. RSI on this timeframe is firmly bullish but MACD has just crossed lower but well above median. If you don’t have a position in this name, one could look for a long entry over 127.08 with a stop near 124.90. There is no specific price target to be specified for CLX but I am considering this as a longer term trade idea. Clorox (CLX) pays a dividend of $3.08 annually and they report earnings on February 3rd.
CLX Daily Stock Chart
CLX Weekly Stock Chart
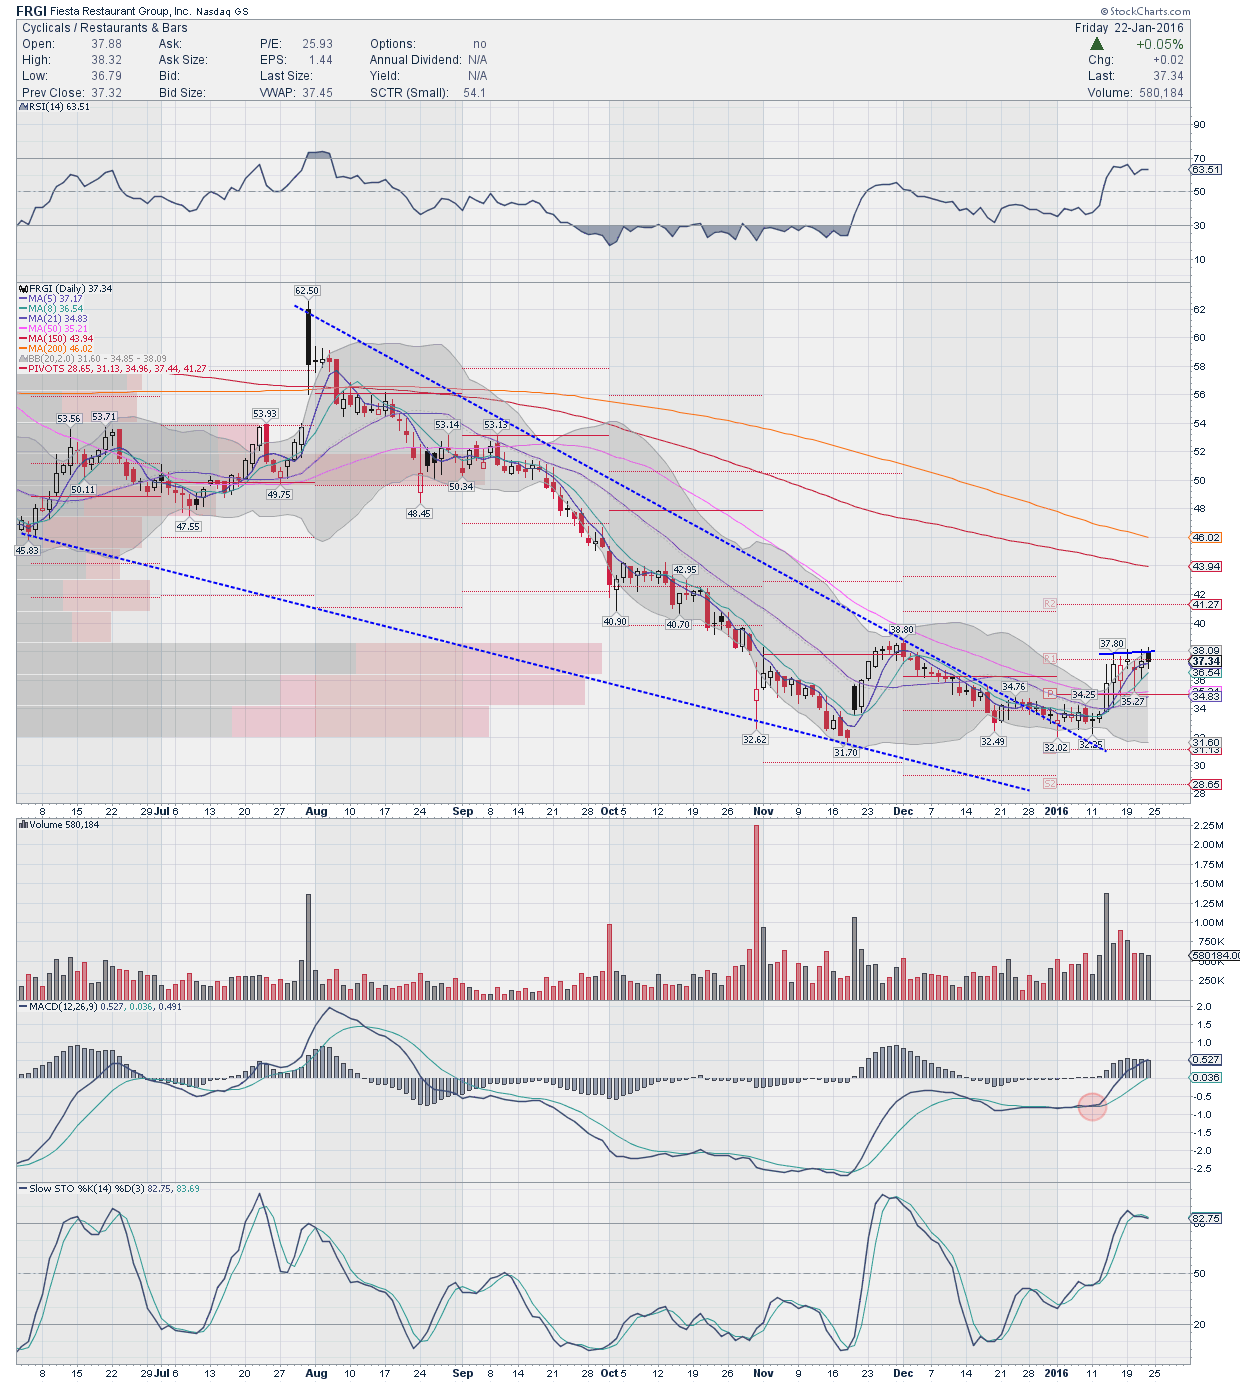
Fiesta Restaurant Group, Inc ($FRGI):
Fiesta Restaurants stock price started its decline steadily from end of July but bottomed in November and moved higher. But that was short-lived as the stock continued to fall but at a slower pace with volume contraction.
FRGI has formed a cup or a saucer like formation. The stock price has formed a bull flag after moving higher during the downtrend in the broad market and has shown relative strength during this time. Looking at a long entry on a move over 38.56 with a stop around 37. FRGI has resistance at 41.27 then 43.94 is where the 150 SMA is. If the stock has more strength, this move can see it’s declining 200 SMA at around 46.02. The main resistance though comes in at 39.30 where the weekly 21 SMA. Above that is the weekly pivot around 45.14. Momentum indicators are bullish and the Bollinger Bands have opened upwards, supporting higher prices. Fiesta Restaurant Group (FRGI) reports earnings on February 18th.
Thanks for reading.
Twitter: @sssvenky
The author does not have a position in any of the mentioned securities at the time of publication. Any opinions expressed herein are solely those of the author, and do not in any way represent the views or opinions of any other person or entity.


