Much is made regarding price action and day type classification.
To keep things simple, let’s consider four possible day type classifications for this article.
We can have:
- Inside range
- Outside range
- Up range
- Down range
These are all pretty self-explanatory and are simply defined by comparing the current day’s (or bar’s) high and low to the previous bar’s high and low, respectively. For example, a down range bar would have a current high beneath the high of the previous bar and a current low beneath the previous low. An up range bar would be the opposite. Of course, we can get more complicated by introducing further spacing when comparing the current bar’s high and low to say the bar three periods ago but we will keep things simple here and only use comparisons between adjacent bars.
I went ahead and counted the number of each day type per year for the S&P 500, the 30 Year Bond, Gold, and Oil. One thing stood out… down range bars just do not happen in the S&P 500 like they did in the past or like they do in the other markets. There is a clear down trend present in the S&P 500 graph in the upper left of the photo below.
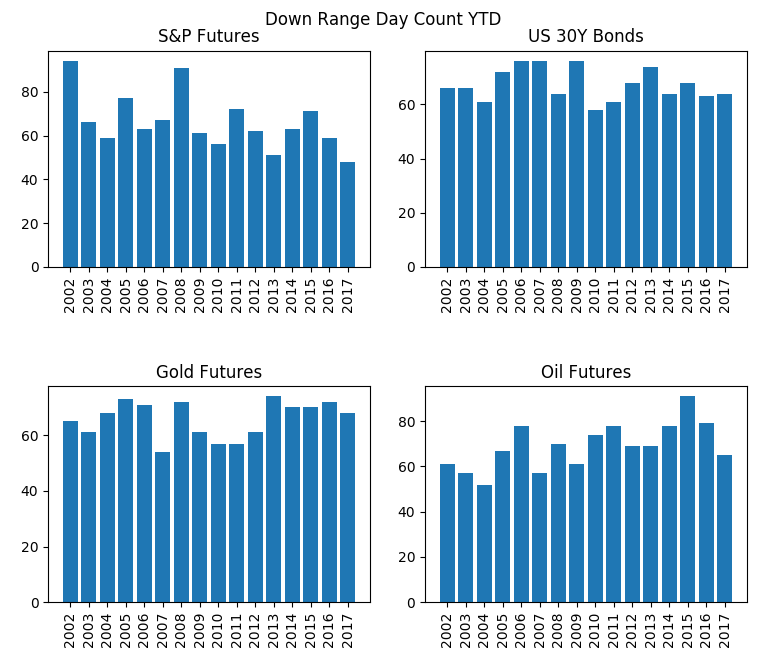
Furthermore, this year has had the lowest number of down range bars YTD with only 48. Matter of fact, it is the only year in any market that has had less than 50 down range bars by this date. The next lowest was the S&P 500 in 2013 with 51.
More importantly, there has been a strong year end performance in the years that the S&P 500 has had less than 60 down range days YTD on Oct 19. For example, 2004 finished the year 6.44% higher from Oct 19, 2010 finished the year 7.87% higher from Oct 19, and finally 2013 finished 5.95% higher from Oct 19.
This is a small sample size but still interesting to think how many managers are currently underperforming. Maybe a catch up rally in the cards?
Of course some will speculate that this “phenomena” or lack of down range days is simply due to market manipulation or just the product of strong momentum in price over the years (which can also be argued). Either way it is a sign of the times and something quantitative-minded traders will notice and adjust their trading systems and styles for.
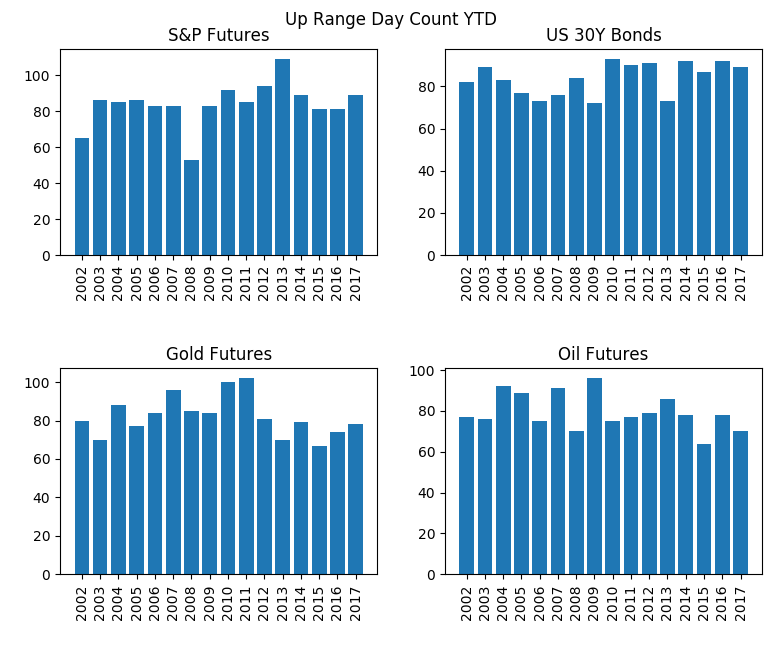
Just for reference here are the other day type counts.
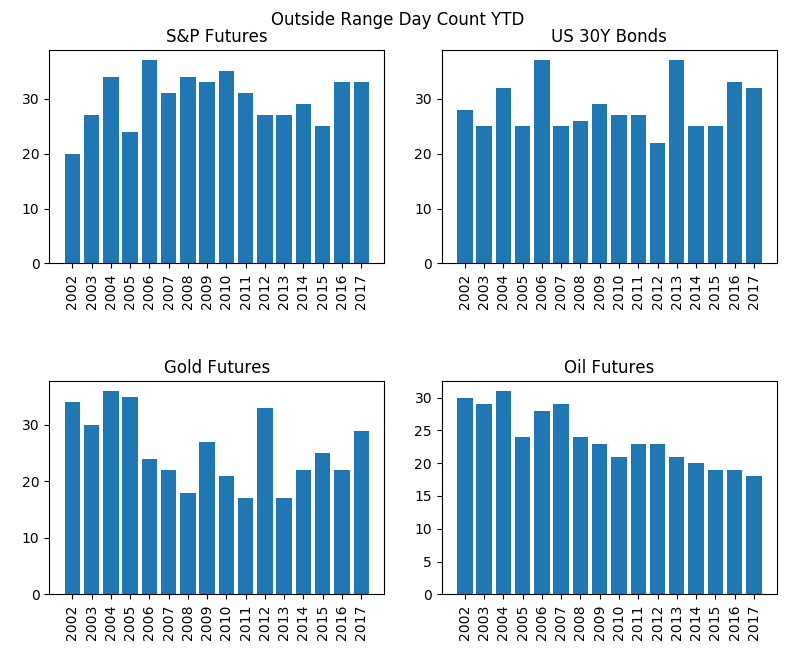
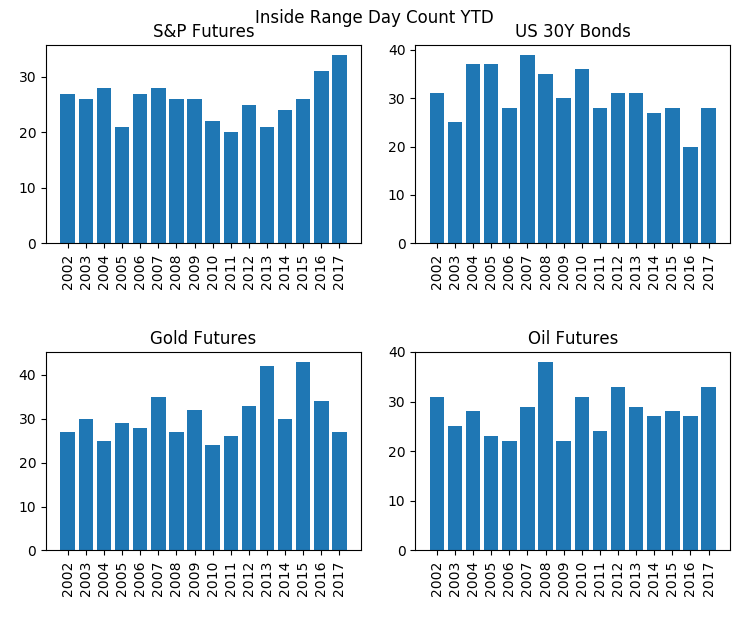
Another obvious trend for future study is the declining number of outside ranges in Oil or the spike in inside ranges for the S&P 500 over the past few years.
Over at Build Alpha, we have tools that can help anyone, even those with no programming capabilities to do simple and complex testing. Thanks for reading.
Twitter: @DBurgh
No position in any of the mentioned securities at the time of publication. Any opinions expressed herein are solely those of the author, and do not in any way represent the views or opinions of any other person or entity.

: Showing Some Signs of Emerging Strength")
