Over the years experience has taught me, more than written word, that developing and adhering to a well-defined process is the foundation for long term success in any endeavor, especially trading. For most, this process includes recognizing “pre-trade” price action.
For example, if trading breakouts, what does the price action need to look like before the breakout?
What characteristics must be present to trade one breakout while disregarding another?
What timeframe(s) are used and, if more than one, is one for action and another for confirmation?
I am often asked how I develop a watch list for potential trades. I usually answer with my own question: what is your trading edge and the process by which you recognize it as such? For you cannot develop a watch list without a trading edge that conforms to it.
So, I present a simple one here as an example to consider.
- Trading Edge: Breakout
- Process: Trading breakouts from well-defined support and resistance “box” along trends
- Pre-trade Price Action: Sideways testing of resistance/support for possible break
- Time Frames: Weekly chart for direction. Daily chart for action and confirmation.
Trading Watchlist: Three Stocks In The Crosshairs
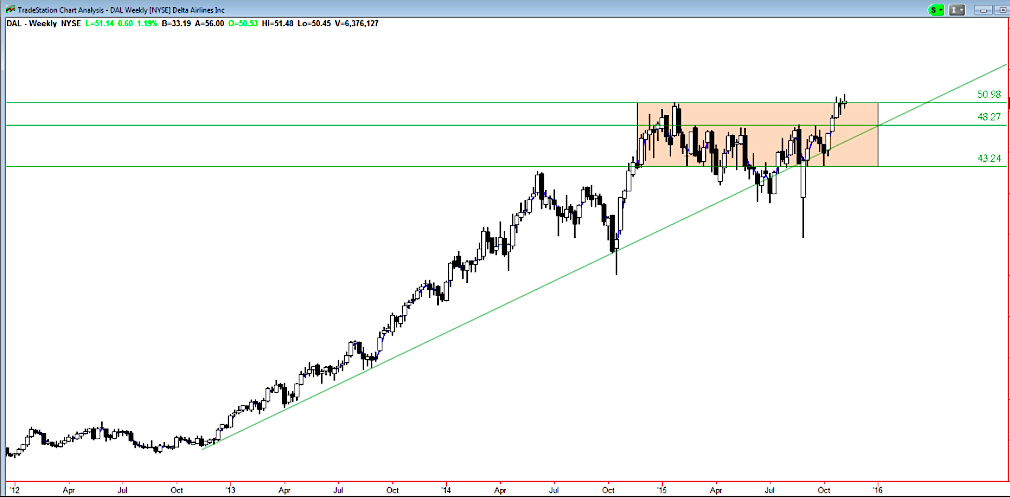
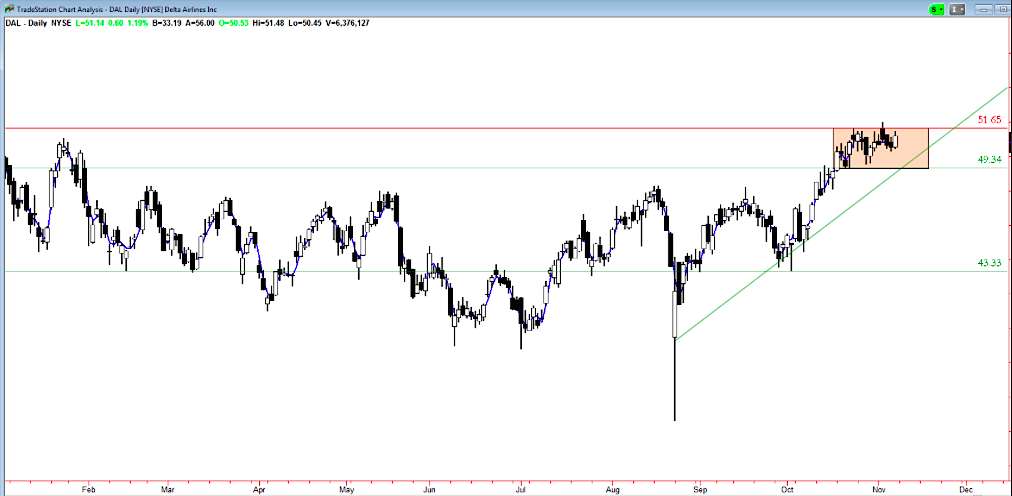
1. Delta Airlines (DAL) is preparing for possible take off as it is currently moving sideways on both the DAILY and WEEKLY charts. A break higher out of the DAILY box would confirm the WEEKLY box break and bullish trend for Delta Airlines stock (DAL).
DAL Weekly Stock Chart
DAL Daily Stock Chart
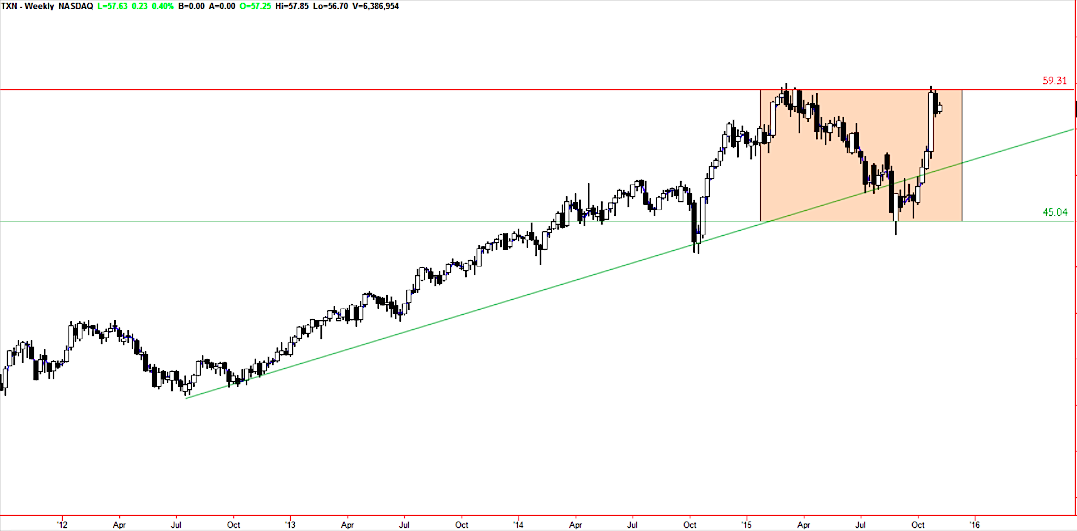
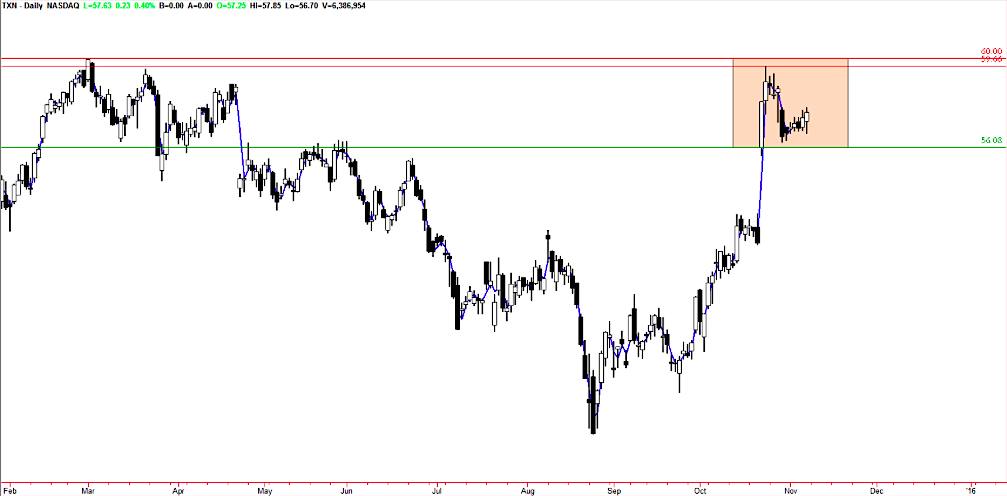
2. Texas Instruments (TXN) has reached a box top resistance on the WEEKLY and is resting for a possible new break and continuation of a longer term bullish trend. The DAILY chart of Texas Instruments (TXN) will confirm the trend if it breaks out of its own box.
TXN Weekly Stock Chart
TXN Daily Stock Chart
continue reading on the next page…


: Showing Some Signs of Emerging Strength")
