Crude oil futures trading in a wide, volatile range in 2016. But traders that knew where the pivots were likely found great success. So as 2017 kicks off, it’s probably a good idea to understand where the 2017 crude oil trading pivots are!
But first, 2016 in review…
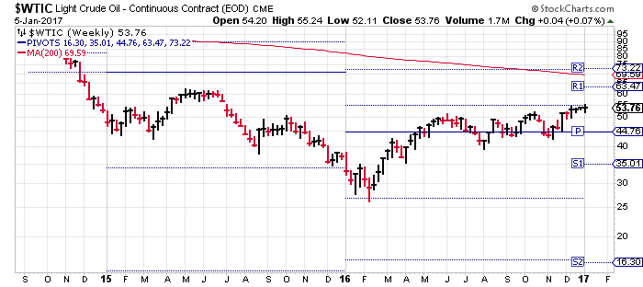
In 2016, the low for Crude Oil (WTIC) was on the YearlyS1 Pivot at $26 and the high was at the YearlyR1 Pivot at $55. Knowing where each of these pivots are helps traders to know where to buy (and where to set stops).
2017 Crude Oil Trading Pivots
In 2017 I see Crude Oil trading between the Yearly Pivot(YP) at $44.76 and the YearlyR1 Pivot at $63.47. These levels should be watched and respected by traders.
Professional oil traders use Pivot Points to show them where to buy & sell. Shouldn’t you?
Thanks for reading.
Twitter: @Pivotal_Pivots
The author may have a position in mentioned securities at the time of publication. Any opinions expressed herein are solely those of the author, and do not in any way represent the views or opinions of any other person or entity.
: Cup (and Maybe Handle) Watch")
 Trading Near Top Of Price Range")
 Reaches Important Price Support")