We’ve covered the term structure of stock volatility indices on several occasions. This, again, refers to the relationship between the various durations, e.g., 8-day, 1-month, 3-month, represented by these indices. Today, we’ll look at the relationship between the 1-month Volatility Index (INDEXCBOE:VIX) and the 3-month Volatility Index (INDEXCBOE:VXV)
The concept is that when nearer volatility indices trade at a historically high extreme versus volatility indices further out, it can signal too much fear on the part of traders and set the stage for a potential rally. Conversely, when near-term volatility expectations become extremely depressed relative to longer-term, it can signal too much complaency and the potential for weakness in the stock market. That latter condition may be present now.
Shorter-term stock volatility expectations have dropped to their lowest levels in more than 4 years.
As recently as late July, we mentioned the relationship between the 1-month volatility index (VIX) and the 3-month (VXV). At the time, the VIX/VXV ratio had dropped to .76 for just the 4th unique time ever. We hinted that it may be a red flag for stocks as they had historically struggled in the short to intermediate-term after similar low ratio readings. The VIX/VXV ratio would remain depressed for much of the next month, leading to a moderate pullback into the election.
Well, following the post-election rally, complacency is back. Today, the VIX/VXV ratio closed at .7469, the 4th lowest reading ever and the lowest since August 2012. Here is the updated chart from the July post showing historically low readings since the inception of the VXV in 2007.
VIX/VXV Ratio Investor Complacency?
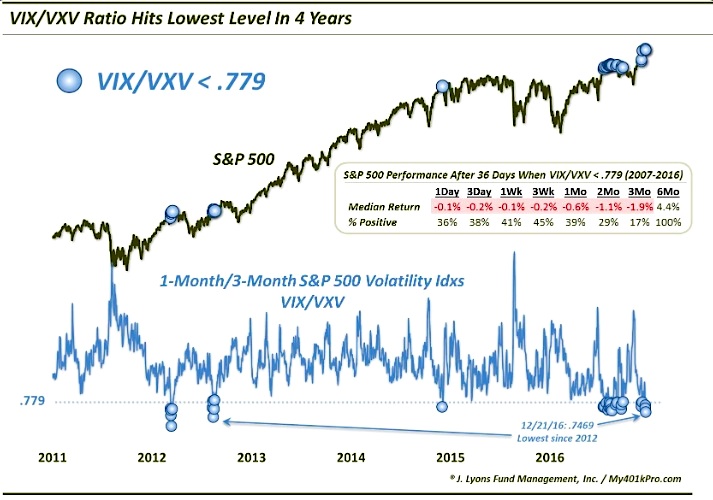
As the chart shows, the .779 level (data-mined to be sure) had been somewhat of a threshold marking extreme lows, with just 13 such readings prior to July (the chart begins in 2012 as there were no occurrences before then). Since July, there have been no fewer than 24 readings below .779. So we need to continue to monitor what really qualifies as “extreme”. Nonetheless, stocks generally did poorly after that July-August period until after the election so let’s stay with the .779 level for purposes of this post.
Before July, the 13 historical readings had seen the S&P 500 (INDEXSP:.INX) lower 3 months later every single time. With the plethora of readings since July, that record is no longer unanimous, but this recent evidence is still consistent with too much complacency in the stock market. Now let’s look at the updated results (see table in chart above).
Again, while the 3-month returns may not be unanimously negative following the signals, they are consistently so. The vast majority of the signals from July to September resulted in lower 2-month and 3-month returns, as was historically the case. And even the handful of September readings that saw the post-election rally boost their 2 and 3-month returns into positive territory suffered at least 4% drawdowns along the way. So through the fall, this signal continues to be a consistent red flag for stocks in the shorter intermediate-term.
On the bright side, the negative ramifications have not historically stretched beyond that time frame. Indeed, while we don’t yet have 6-month returns for the post-July period, all 13 VIX/VXV ratio readings below .779 prior to this year saw the S&P 500 higher 6 months later.
So while the term structure of stock volatility indices presently suggests too much complacency in the market, the risk has typically manifested itself most in the 2 to 3-month period. Therefore, even if that weakness comes to pass, it doesn’t preclude further gains in the longer-term. Nor, by the way, does it preclude a Santa Claus Rally over the next few weeks. However, it does suggest that whatever presents Santa might bring to stock traders may eventually get returned.
Twitter: @JLyonsFundMgmt
Read more from Dana on his blog.
The author does not have a position in mentioned securities at the time of publication. Any opinions expressed herein are solely those of the author, and do not in any way represent the views or opinions of any other person or entity.

: Showing Some Signs of Emerging Strength")
