In our May 8 post, we suggested that the rise in treasury yields would be short-lived, and that the resumption of a downward trend in yields would coincide with bonds finding support.
It now appears that yields and bond prices are responding to the initial targets on our charts, making this month a likely candidate for reversals in both. Here we present updated charts featuring the nearby targets and also a set of fallback targets for the 30-Year Treasury Yield and 20+ Year Bond ETF (TLT).
On a monthly chart, the CBOE 30-year Treasury Yields Bond Index (TYX) continues to recognize the orderly channel that has guided yields lower since 2007. Note that the index acknowledged resistance at our first target area of 30.92, and also note that the upper range of price in June has tested and fallen away from one of the harmonic lines of the channel. In addition, treasury yields are currently in their cyclical downward phase.
It is reasonable to watch for a reversal in yields from near the present area. However, if the first resistance fails to hold, then another test closer to the channel boundary may be possible. Both of the labeled resistance areas were calculated based on Fibonacci extension ratios.
30 Year Treasury Yield Monthly Chart
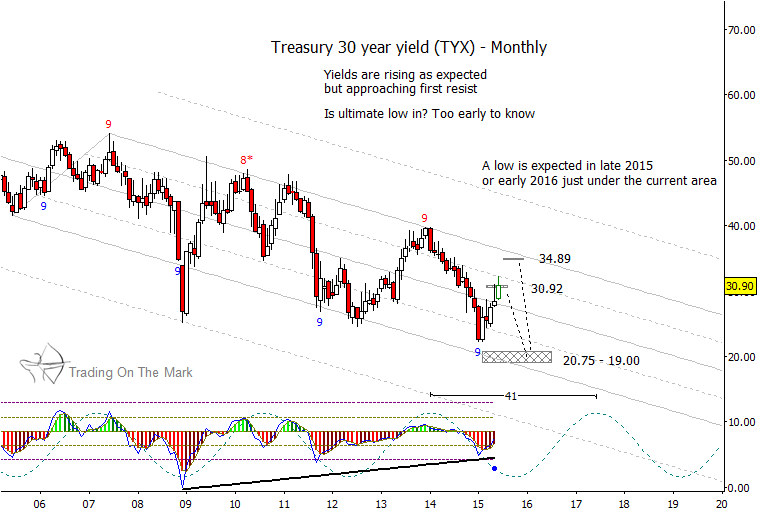
We expect yields eventually to make a durable low later this year or early next year, probably in the region near 19.00 to 20.75. The building momentum divergence shown on the TYX chart hints that the larger downward trend probably does not have much farther to go.
We see a similar but inverted development with treasury bond futures, as reflected by the iShares Barclays 20+ Year Treasury Bond ETF (TLT). Just as treasury yields are testing our first resistance target, the ETF is testing our first support area near 117.18 to 119.97. A fallback support zone lies about 10 points lower near 107.60 to 109.75.
20+ Year Treasury Bond ETF (TLT) Monthly Chart
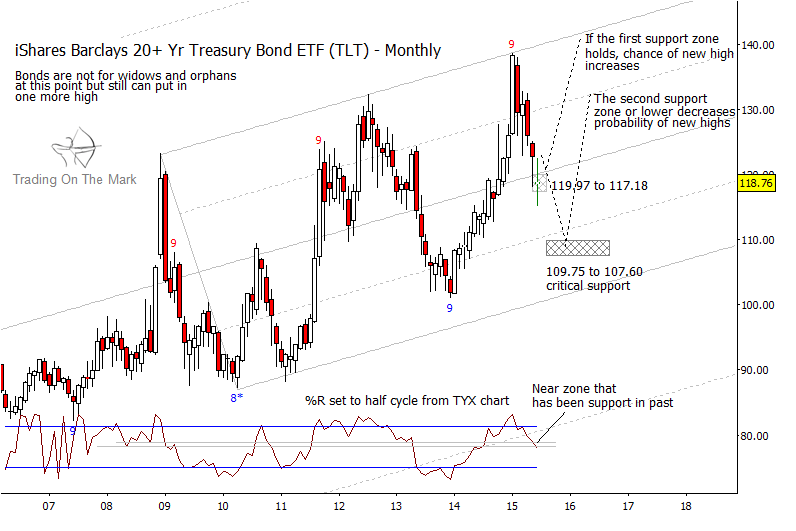
The ETF chart highlights where the trader might look for a medium-term opportunity, but it also shows some of the signals we will be watching in order to forecast the next big-picture development. As we mentioned in our earlier post, we believe treasury bonds are setting up a major topping pattern. The way that bonds and the ETF treat the support targets this year may indicate whether the next stage of the pattern will involve a final higher high or will instead produce a lower high in 2016 or 2017.
We are keeping our subscribers abreast of these developments with addititional charts and analysis on weekly and even daily time frames. We’d also like to offer See It Market readers some exclusive charts and analysis that can help you catch the summer trades. Readers who request it this week will also receive an updated post with more detailed information on near-term treasury bond targets.
Twitter: @TradingOnMark
No position in any of the mentioned securities at the time of publication. Any opinions expressed herein are solely those of the author, and do not in any way represent the views or opinions of any other person or entity.

: Showing Some Signs of Emerging Strength")
